Download
1 / 45
450 likes | 531 Views
Integrated, observation-based carbon monitoring for wooded ecosystems in Washington, Oregon, and California. Kickoff meeting January 20, 2011. The Plan. Brief project history Who we are: Intro to co-investigators and collaborators What we proposed to do: Review goals and products

E N D
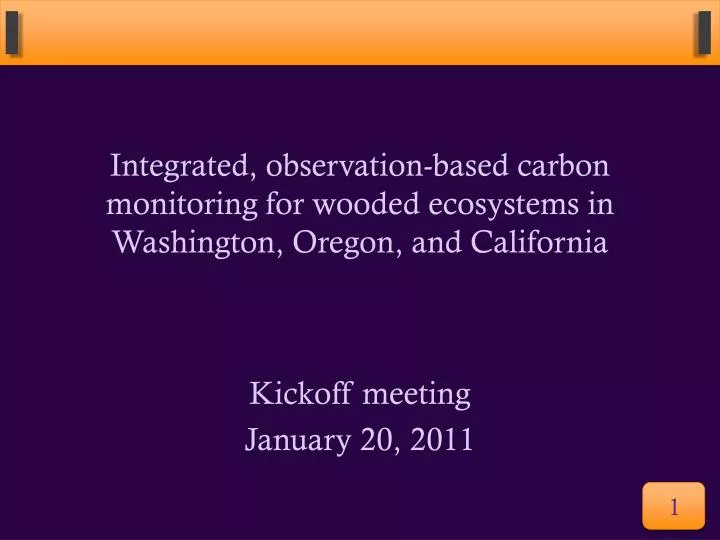
Integrated, observation-based carbon monitoring for wooded ecosystems in Washington, Oregon, and California Kickoff meeting January 20, 2011
The Plan • Brief project history • Who we are: • Intro to co-investigators and collaborators • What we proposed to do: • Review goals and products • How and when we’ll do it: • Timeline, budgets, etc.
Brief project history • Proposal to NASA-ROSES Carbon Cycle Science call in June 2010 • Overall call:http://nspires.nasaprs.com/external/viewrepositorydocument/cmdocumentid=221220/A.5%20Carbon%20Cycle.pdf • Our proposal: http://landtrendr.forestry.oregonstate.edu/sites/default/files/kennedy_Cproposal_textonly_final.pdf • Proposal reviewed very well (15 E, 4 VG) • See http://landtrendr.forestry.oregonstate.edu/sites/default/files/panel_reviews_carbon.pdf
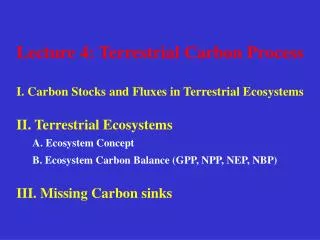
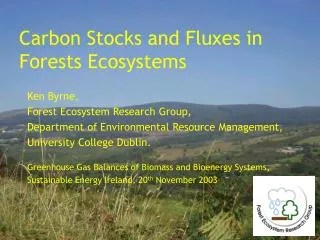
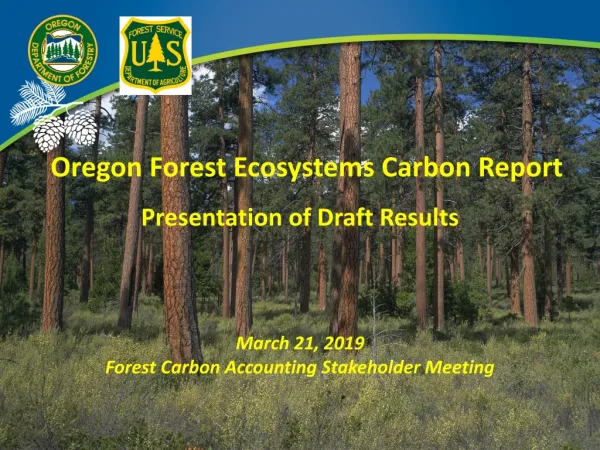
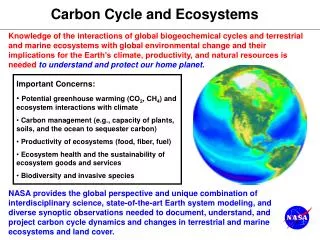
Brief project history • Goals and themes: • Evaluate forest carbon pools and fluxes for Washington, Oregon, and California through development of an empirical carbon modeling system • Understand role of disturbance by type and location on the landscape • Develop monitoring structure that is modular and that explicitly incorporates uncertainty
Brief project history • Selected by USDA-National Institute of Food and Agriculture (NIFA) Agriculture and Food Research Initiative Competitive Grants Program (AFRI) • http://nspires.nasaprs.com/external/viewrepositorydocument/cmdocumentid=252041/CARBON10%20Selections.pdf • Our program manager: Nancy Cavallaro • Change of funding source required changes in sub-contracts, re-submission of budgets, etc. • Current status: Re-submission of budgets in review at OSU, anticipating either Feb 15 or March 1 start date
Who we are • Project composed of: • Investigators • Produce deliverables, conduct analysis • Collaborators • Ensure relevance of goals and deliverables
Who we are • Investigators • Kennedy • Oregon State University, Laboratory for Applications of Remote Sensing in Ecology (LARSE; www.fsl.orst.edu/larse/) • Ohmann • USDA Forest Service, Pacific Northwest (PNW) Research Station, Landscape Ecology, Modeling, Mapping & Analysis (LEMMA; www.fsl.orst.edu/lemma/) • Cohen • PNW Research Station, LARSE
Who we are • Investigators (Continued) • Franklin, Kane, Lutz • University of Washington • Powell • Montana State University
Who we are • Collaborators • Richard Bigley, Washington State Department of Natural Resources • Mark Harmon, Oregon State University • Helen Maffei, USDA FS • George McFadden, USDI Bureau of Land Management • Robert McGaughey, USDA FS
Who we are • Collaborators (continued) • John Pierce, Washington State Department of Fish and Wildlife • David Rolph, The Nature Conservancy • Klaus Scott, California Air Resources Board • David Turner, Oregon State University • Andrew Yost, Oregon Department of Forestry
What we proposed to do • Underlying premise: • In wooded systems, carbon stocks and fluxes are constrained by type, age, and health of trees and shrubs • Forest type, age, and health across landscapes now observable through combination of remote sensing, field measurement, and statistical modeling • Our role: • Use actual observations and empirical modeling to provide sideboards for estimation and mechanistic modeling communities, addressing key science and management questions along the way
What we proposed to do • Emphasis on modularity and uncertainty • We know that any statistical estimation of carbon fluxes and stocks is imperfect, so we intend to build a system that can incorporate better approaches as they become available (modularity) and that characterizes what we do and do not think we know (uncertainty)
What we proposed to do • Underlying science and management questions: • How much have forest carbon pools or fluxes been affected by natural processes (insects, fire, wind, growth) versus anthropogenic processes (harvest, land-use change)? Are the relative impacts of those processes constant or changing as policy and climate also change? See http://landtrendr.forestry.oregonstate.edu/sites/default/files/kennedy_Cproposal_textonly_final.pdf
What we proposed to do • Underlying science and management questions: • How have those processes of change been distributed across forest types, ownerships, management approaches, and policy periods? See http://landtrendr.forestry.oregonstate.edu/sites/default/files/kennedy_Cproposal_textonly_final.pdf
What we proposed to do • Underlying science and management questions: • Has forest management intended to reduce susceptibility to insect and fire actually reduced vulnerability of carbon pools to unplanned loss a regional scale? See http://landtrendr.forestry.oregonstate.edu/sites/default/files/kennedy_Cproposal_textonly_final.pdf
What we proposed to do • How to address those questions? • Develop a modular, observation-based carbon monitoring system that incorporates remote sensing, FIA plot, and lidar data • Use that system to generate set of key deliverables
Proposed deliverables • 30m resolution maps (1985-2010) of: • Forest aboveground live and dead carbon pools • Changes in pools from year to year • Forest disturbance magnitude and year • Agent of disturbance • Forest regrowth rate and time period • Forest type and condition • Uncertainty estimation based on accumulated errors and in comparison to lidar-based maps
Our proposed system Uncertainties through Monte Carlo-type analysis
Our proposed system • Example disturbance information:
Our proposed system • Linking satellite data to FIA plot data
Proposed system: Uncertainty mapping • Each module contains “noise” • Disturbance maps: Index used, parameters chosen • GNN: Input variables, nearest neighbor rules, variability in source imagery from LandTrendr • Biomass calc’ns: Variation in allometrics, variation in tree lists • Lidar: Variation in allometrics, locational
Proposed system: Other points? • Co-investigators: Any other details or important points about your module that may be of interest to collaborators/users? • (hold off on logistics until second half of call)
Proposed system: Uncertainty mapping • Our goal: • Run multiple instances of each module • Uncertainty accumulates from module to module, resulting in a distribution of estimates for each pixel • Maps produced will include both median condition, as well as 20/80 percentile or similar
Proposed deliverables • 30m resolution maps (1985-2010) of: • Forest aboveground live and dead carbon pools • Changes in pools from year to year • Forest disturbance magnitude and year • Agent of disturbance • Forest regrowth rate and time period • Forest type and condition • Uncertainty estimation based on accumulated errors and in comparison to lidar-based maps
Proposed system: Feedback • From our collaborators: • Do these products make sense? • What more do you need to know about them to evaluate utility? • What other products are of interest? • How involved do you want to be in evaluating products as they become available? • What other projects should we be collaborating with, learning about, etc.?
Moving on • Collaborators free to stay or go at this point • Next big topics: Project logistics and implementation
How we plan to do it • Key logistical issues to begin addressing: • Overall project timing • Module dependencies • Any known new obstacles, concerns • Other topics?
Project timeline • Budgets are in review at OSU for submission to USDA system • Official start date: Feb 15? March 1? • Tasks: • 1. Develop statewide disturbance, growth, and change agent maps for WA, OR, CA 1985-2010 • 2. Develop forest carbon maps using nearest neighbor mapping to link FIA and satellite data • 3. Develop lidar-based carbon surfaces for selected sites
Module dependencies • In year 1 and 2, integration of LandTrendr and GNN teams is crucial (Kennedy, Ohmann, Cohen) • Biomass equations and some sense of uncertainties in those equations set the stage for both GNN and lidar mapping (Powell)
Module dependencies • Lidar work begins in year 2 and can proceed in largely parallel track • We just need to make sure that we envision the comparisons we’ll make at the end as we design the lidar-based mapping • Integration of lidar-based and GNN-based carbon maps happens in year 3 • Everyone gets involved!
Module dependencies: End game This error analysis phase occurs in the final year
Paper topics by objective • Objective 1: • How much aboveground live forest carbon has been converted to other pools by all disturbance at regional scales? How much is accumulating through post-disturbance growth of forest? • What are the observed effects of different forest management strategies on forest carbon? How are different agents of forest change distributed across ownership sectors and climatic gradients?
Paper topics by objective • Objective 1: • How much of the loss is caused by natural versus anthropogenic agents? How do different agents of carbon loss (clearcuts, thinnings, conversion, fire, insects, etc.) compare in cumulative losses? How much is cyclical (loss followed by growth) vs sustained (conversion of forest to other land uses)? • How variable are rates of disturbance-related carbon loss annually? To what extent are carbon loss rates at regional scales attributable to climatic, economic or policy factors?
Paper topics by objective • Objective 2: • How much does forest thinning affect subsequent occurrence of fire or insect attack? Are unmanaged forests more likely to burn or suffer insect outbreak than are managed forests? • Which ownerships or forest types have the greatest potential to accumulate carbon? Which have been most vulnerable to fire or insect-related loss?
Papers by objective • Objective 3: • Which components of the observational monitoring system contribute most to uncertainty in estimates? • Can knowledge of recent forest history improve estimation of the current condition of forest carbon uptake, storage, and loss? • Which characteristics of disturbance patches are most useful for ascribing causal agents to change? • How can carbon estimation through small-footprint lidar best be used to evaluate effectiveness of large-area carbon maps? Which approaches to mapping carbon with lidar data promote generic monitoring by transferability across different forest conditions?
Other paper topics? • Methods-type papers? • Mapping uncertainty, nearest-neighbor rules, lidar approaches? • Other science/mgmt questions?
Project budgets • Year 1 total after taxes: ~$192k • Of which: MSU (Powell): $23K • Year 2 total: $251k • Of which: UW (Franklin/Kane/Lutz): $118k • Year 3 total: $216k • Of which: UW: $61k, MSU: $22k
Logistics • Needs for next meeting • Timing, goals