Download
1 / 1
10 likes | 151 Views
MÓNICA HERNÁNDEZ ALAVA AND ALLAN WAILOO Health Economics and Decision Science, School of Health and Related Research ( ScHARR ), University of Sheffield, UK Email: m.hernandez@sheffield.ac.uk Web: www.shef.ac.uk/scharr/sections/heds/staff/hernandez_m.

E N D
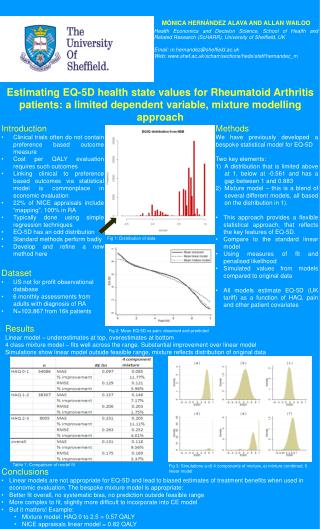
MÓNICA HERNÁNDEZ ALAVA AND ALLAN WAILOO Health Economics and Decision Science, School of Health and Related Research (ScHARR), University of Sheffield, UK Email: m.hernandez@sheffield.ac.uk Web: www.shef.ac.uk/scharr/sections/heds/staff/hernandez_m Estimating EQ-5D health state values for Rheumatoid Arthritis patients: a limited dependent variable, mixture modelling approach • Introduction • Clinical trials often do not contain preference based outcome measure • Cost per QALY evaluation requires such outcomes • Linking clinical to preference based outcomes via statistical model is commonplace in economic evaluation • 22% of NICE appraisals include “mapping”, 100% in RA • Typically done using simple regression techniques • EQ-5D has an odd distribution • Standard methods perform badly • Develop and refine a new method here • Dataset • US not for profit observational database • 6 monthly assessments from adults with diagnosis of RA • N=103,867 from 16k patients • Methods • We have previously developed a bespoke statistical model for EQ-5D • Two key elements: • A distribution that is limited above at 1, below at -0.561 and has a gap between 1 and 0.883 • Mixture model – this is a blend of several different models, all based on the distribution in 1). • This approach provides a flexible statistical approach, that reflects the key features of EQ-5D. • Compare to the standard linear model • Using measures of fit and penalised likelihood • Simulated values from models compared to original data • All models estimate EQ-5D (UK tariff) as a function of HAQ, pain and other patient covariates Fig 1: Distribution of data Results Linear model – underestimates at top, overestimates at bottom 4 class mixture model – fits well across the range. Substantial improvement over linear model Simulations show linear model outside feasible range, mixture reflects distribution of original data Fig 2: Mean EQ-5D vs pain: observed and predicted Table 1: Comparison of model fit Fig 3: Simulations a-d) 4 components of mixture, e) mixture combined, f) linear model • Conclusions • Linear models are not appropriate for EQ-5D and lead to biased estimates of treatment benefits when used in economic evaluation. The bespoke mixture model is appropriate: • Better fit overall, no systematic bias, no prediction outside feasible range • More complex to fit, slightly more difficult to incorporate into CE model • But it matters! Example: • Mixture model: HAQ 0 to 2.5 = 0.57 QALY • NICE appraisals linear model = 0.82 QALY