Download
1 / 17
170 likes | 250 Views
Visualizing Kermit Shallows. By: Alex, Kylie, Kayla,& Gabe. Pond Definition and Parts. A pond is commonly described as a quiet body of water so shallow that rooted plants can grow completely across it. The definition of a pond may differ from place to place.

E N D
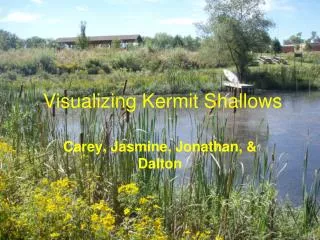
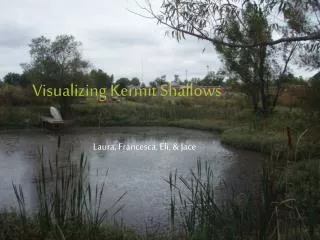
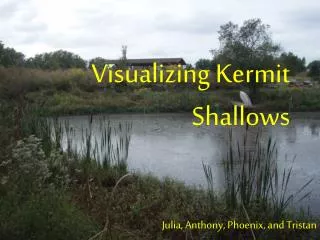
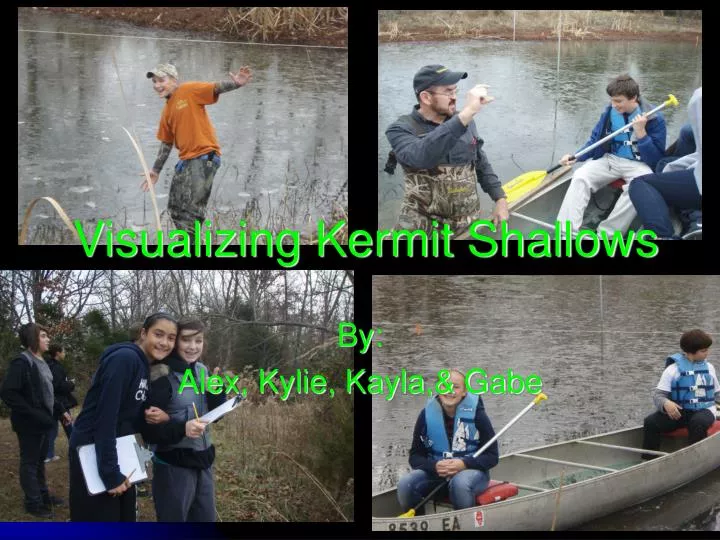
Visualizing Kermit Shallows By: Alex, Kylie, Kayla,& Gabe
Pond Definition and Parts • A pond is commonly described as a quiet body of water so shallow that rooted plants can grow completely across it. The definition of a pond may differ from place to place. • Reid, G.K. (2001). Pond Life. New York, NY: St. Martin’s Press.
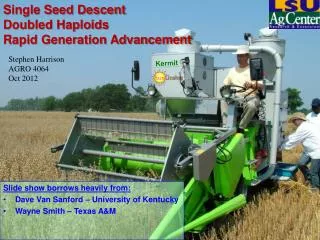
Gathering Data • Pond Profile Data Collection • 1. A transit line was put around the pond starting at the northwest corner and leveled using bubble levels. • 2. Stakes were put every 5 m around the pond. 3. Flags were placed on each stake so that they could be found. 4. Starting at the northwest corner, a string with flags at every 5 m was run across the pond. The first 5 meter flag on the string was placed on the stake on the north side and brought down level with the transit string. The string was leveled on the south side of the pond using a bubble level above the corresponding stake. The string was kept tight.
5. Measurements were taken at each flag on the string using a 2.4 m pole that had been marked off in .5 dm units. Measures above dry soil were given positive values (+) and measurements below water level were given negative values (-). • 6. Measures were taken for all 15 stakes on the north and south side.
Filtering Data In this data only 13 stakes were used, the 14th and 15th stakes on each side were added in as 0 values as can be seen on the next slide.
Conclusion • The deepest part of the pond was near the east side. (widest side) • The maximum depth of the pond was -1m. • The shallowest point was at the west end of the pond. (thinnest side)
References • gnuplot download (version 4.4). Retrieve August 23, 2010, from http://sourceforge.net/projects/gnuplot/files/ • Microsoft Excel. (2003). Microsoft. • NCSA Visualization Suite. Retrieved August 23, 2010, from http://education.ncsa.illinois.edu/resources/software_tools/vizsuite.html • Reid, G. K. (2001). Pond Life. New York, NY: St. Martin’s Press.