Download
1 / 13
2.85k likes | 11.94k Views
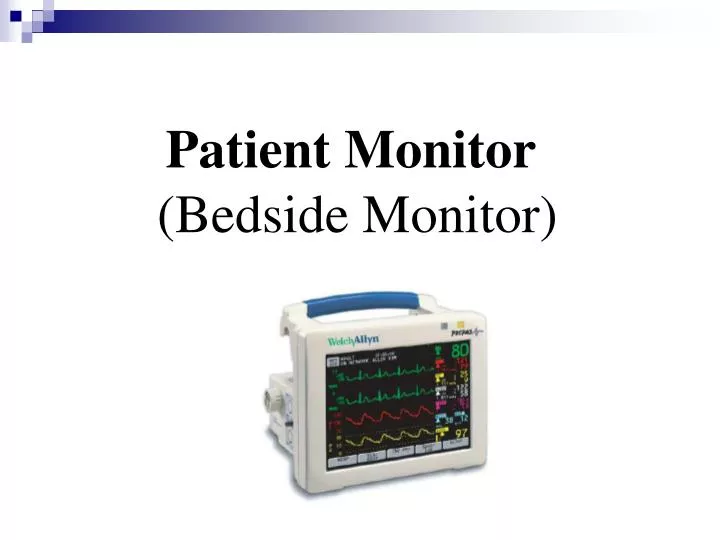
Patient Monitor (Bedside Monitor). Parameter Measured in Patient Monitor. ECG SpO2 BP (IBP ,NIBP) R-R HR Temp Co 2 Concentration. ECG Block Diagram.

E N D
Parameter Measured in Patient Monitor • ECG • SpO2 • BP (IBP ,NIBP) • R-R • HR • Temp • Co2 Concentration
Figure 8.6 Block diagram of an electrocardiograph. The normal locations for surface electrodes are right arm (RA), right leg (RL), left arm (LA), and left leg (LL). Physicians usually attach several electrodes on the chest of the patients as well.
VA VB VB Figure 8.7 A circuit of an ECG amplifier. The instrumentation amplifier, located on the left of the circuit provides a high input impedance and has a gain of 25 in the dc-coupled stages. From Webster, J. G. (ed.) 1998. Medical instrumentation: application and design, 3rd ed. New York: John Wiley & Sons.
Blood Pressure Pressure/mmHg Figure 8.19 The sphygmomanometer detects arterial opening and closing that occurs between systolic and diastolic pressures.
Figure 8.21 Top: Cuff pressure with superimposed Korotkoff sounds, which appear between systolic and diastolic pressures. Bottom: the oscillometric method detects when the amplified cuff pressure pulsations exceed about 30% of maximal pulsations. From Geddes, L. A. Cardiovascular devices and their applications. New York: Wiley. 1984.8.9.2 Direct measurement
Temp Measurement Figure 10.5 An electronic thermometer uses a thermistor sensor probe.
ICU Bed Bed Bed Bed Nurse station Telemetry WEB connection