Download
1 / 67
670 likes | 674 Views
IC Controls provides highly reliable conductivity measurement analyzers used for industrial purposes to increased efficiency of work and less operating cost. Visit website to shop now! https://iccontrols.com/products/conductivity/analyzers-conductivity/

E N D
USER MANUAL MODEL 455 CONDUCTIVITY ANALYZER um-455-212
CONTENTS IC Controls CONTENTS um-455-212 CONTENTS.............................................................2 455 MENUS.............................................................3 INTRODUCTION....................................................6 Features....................................................................6 Specifications...........................................................7 INSTALLATION.....................................................9 Analyzer Mounting..................................................9 Wiring......................................................................9 Sensor Mounting....................................................10 Sensor Wiring........................................................10 Instrument Shop Test Startup................................10 STARTUP..............................................................12 Analyzer Start-up Tests.........................................12 Start-up Settings.....................................................12 EASY MENU.........................................................13 Remembers Where You Were...............................13 Home Base: Press Sample.....................................13 Display Features....................................................13 Arrow Keys............................................................14 AUTO and MANUAL Keys..................................14 Standby Mode........................................................14 EDIT MODE..........................................................15 Temperature °C or °F............................................16 Input Damping.......................................................16 Real-Time Clock....................................................16 CONDUCTIVITY MEASUREMENT..................17 What is conductivity?............................................17 Conductivity Units.................................................17 What is a Cell Constant?........................................17 Measurement Range...............................................18 Manual Range Switching.......................................18 Cell Constant and Range........................................18 Guide to Cell Constant Usable Ranges..................18 Displayed Conductivity Units................................19 CONDUCTIVITY CALIBRATION......................20 Selecting a Standard..............................................20 Calibration Using Standards..................................21 Calibration by Grab-Sample..................................22 Air Zero Calibration..............................................23 Temperature Compensation (TC)..........................24 Conductance Data for Commonly-Used Chemicals ...............................................................................26 ERROR MESSAGES.............................................27 Acknowledging an Error Message.........................27 Error Messages for Conductivity...........................28 Error Messages for Temperature...........................29 Caution Messages for Alarms................................29 SENSOR INSTRUCTIONS...................................30 Preparation for use.................................................30 Calibration for Conductivity..................................30 Sensor Storage.......................................................30 Monthly Maintenance............................................30 Yearly Maintenance...............................................31 Restoring Sensor Response....................................31 4 mA TO 20 mA OUTPUT SIGNALS..................33 Reversing the 4 mA to 20 mA Output...................33 Simulated 4 mA to 20 mA Output.........................33 Units for Outputs...................................................34 Automatic Range Switching..................................34 Using the Alarm Contacts......................................35 Using the Second 4 mA to 20 mA Output.............35 Output Characterization.........................................36 ALARM FUNCTIONS..........................................38 Use of Relay Contacts............................................38 Alarm Indication....................................................38 Alarm Override......................................................39 Wiring and NO/NC Contacts.................................39 Delayed Activation................................................39 Deviation Alarm.....................................................39 High or Low Alarm................................................40 Fault Alarm............................................................41 Using Alarms for On/Off Control..........................41 CONFIGURATION OF PROGRAM....................42 TROUBLESHOOTING.........................................43 Troubleshooting Hints...........................................43 ELECTRONIC HARDWARE ALIGNMENT......45 DISPLAY PROMPTS............................................48 GLOSSARY...........................................................50 Appendix A — Security.........................................51 Appendix B — Output Characterization................54 Appendix C — Parts List........................................55 Appendix D — Default Settings.............................56 Appendix E — Serial Output..................................57 DRAWINGS..........................................................59 D5920093: Wiring & Component Location..........59 D5980176: Display Component Location............60 D5920095: 400 Junction Box Wiring...................61 D4830022: Mounting Dimensions........................62 D4950053: 2 inch Pipe/Wall Mounting Kit..........63 D4950054: Panel Mounting Kit............................64 INDUSTRIAL PRODUCTS WARRANTY..........65 INDEX....................................................................66 ? Copyright 2006 IC Controls Ltd. All rights reserved. Page 2 www.iccontrols.com um-455-212
IC Controls 455 MENUS 455 MENUS CHANGES Areas shaded in dark orange indicate program settings which can be changed by the user. Menu areas shaded in light blue indicate view- only. Illustration 1: Menu overview um-455-212 www.iccontrols.com Page 3
455 MENUS IC Controls Illustration 2: Configuration menu Illustration 3: Alarm menu Page 4 www.iccontrols.com um-455-212
IC Controls 455 MENUS Illustration 4: Internal data log menu Illustration 5: Serial menu um-455-212 www.iccontrols.com Page 5
INTRODUCTION IC Controls INTRODUCTION The model 455 is IC Controls’ industrial-quality remote operational CONDUCTIVITY analyzer, designed to give maximum flexibility, reliability, and ease-of-use. The model 455 is shipped from the factory calibrated at 0 µS/cm to 1 000 µS/cm and 4 mA to 20 mA and should not require recalibration other than sensor cell constant installation (if different from 1.0/cm). It has four auto-ranging input ranges, two isolated 4 mA to 20 mA outputs, two 10 A SPDT relays, plus a serial communication port. Its microprocessor intelligence recognizes specific conductivity standards to auto-calibrate, holds output during calibration, notifies user of diagnosed sensor or analyzer faults, plus stores in memory the last 12 calibration records, 1 000 minute measurement trend, alarms, power outages, and diagnostic messages, all date and time stamped. The 455 is one of a series of 115/230 VAC process analyzers supplied in a corrosion resistant IP65 (NEMA 4X) water and dust-tight case. These analyzers are also available for pH, ORP, dissolved oxygen and chlorine, plus as two-wire versions with an optional explosion proof rating. In the case of conductivity, the analyzer powers a sensor and measures the resulting signal corresponding to the actual conductivity and temperature. The analyzer conditions and digitizes the signal for maximum accuracy, and then sends it out as a digital output and/or on 4 mA to 20 mA outputs. Features The 455 CONDUCTIVITY analyzer features: 1. Intuitive user friendly program; easy-to-use. 2. Auto-calibration; recognizes specific conductivity standards. 3. Auto-ranging over 4 input ranges. 4. Self and sensor diagnostics. 5. Output hold during calibration. 6. Stores 12 calibration records. 7. Stores alarms, caution and error messages. 8. Stores running 1 000 minute conductivity trend. 9. Two programmable 4 mA to 20 mA outputs. 10.Two programmable alarms. 11.Serial digital output and for remote operation. 12.Optional PID control. 13.Optional concentration measurement in % NaOH, % H2SO4, % HCl and % NaCl. 14.Optional measurement of TDS, resistivity and salinity. 15.Three level security to protect settings. 16.Hidden alignment; accessible when needed. 17.Durable housing; IP65, NEMA 4X. Page 6 www.iccontrols.com um-455-212
IC Controls INTRODUCTION Specifications Physical Data PROPERTY CHARACTERISTIC Display Four and one half LCD digits, 1.5 cm (0.6 in) displays for conductivity, temperature, error codes, prompts and diagnostic information (back-lit display optional) Display Ranges Conductivity: 0 µS/cm to 1 µS/cm, 0 µS/cm to 1,000 µS/cm, and 0 mS/cm to 1,000 mS/cm Temperature: -10.0 °C to 210 °C (14.0 °F to 410 °F) Keypad 8 pushbutton entry keys LED's 2 alarms (A and B), 1 auto, 1 error Case Dimensions 12.0 cm (H) ? 20.0 cm (W) ??7.5 cm (D) (4.7 in (H) ? 7.9 in (W) ? 3.0 in (D)) Weight 1.1 kg (2.5 lb) Shipping Weight 2.3 kg (5.0 lb) Shipping Dimensions 30 cm ?????cm ??23 cm (12 in ????in ??9 in) Environmental Data PROPERTY CHARACTERISTIC Temperature Operational: 5.0 °C to 45 °C (41.0 °F to 113 °F) Storage: -10.0 °C to 55 °C (14.0 °F to 131 °F) Relative Humidity: 95 % maximum; non-condensing Environment Ratings Housing: IP65 (Nema 4X) Pollution Degree: 2 Installation Category: II Electrical Ratings 115/230 VAC, 0.25 A, 50/60 Hz Electrical Requirements 115/230 VAC ± 10 %, 50 W es-455-1.2 um-455-212 www.iccontrols.com Page 7
INTRODUCTION IC Controls Specifications Operational Data PROPERTY CHARACTERISTIC Accuracy Conductivity: ± 0.2 % of measured range Temperature: ± 0.1 °C Precision Conductivity: ± 0.1 % or 2 digits, whichever is greater. Temperature: ± 1 digit (0.1 °C) Response Time 90% within 5 s (default), function of flow and temperature. Damping adjustment: 3 s to 99 s Temperature Compensation Compensation Type Function Characteristic Linear Default 2 % per °C Adjustable 0.1% to 5.0% per ?C None USP 23 <645> High Purity Selectable Neutral, acidic, basic, ASTM D1125 or latest. NaOH, H2SO4, HCl or NaCl. % Concentration Selectable Automatic 1000 ? RTD Auto: -10.0 °C to 210 °C (14.0 °F to 410 °F) Manual: -10.0 °C to 210 °C (14.0 °F to 410 °F) Cell Constant Range 0.001/cm to 100.0/cm Auto-Range Multipliers Cell constant ?100, ?1000, ?10,000, or ?100,000 Security 3 access-level security; partial and/or all settings may be protected via 3- and/or 4 digit security code. Alarms Two independent, assignable, programmable, configurable, failsafe NO/NC or auto-range BCD alarm relays; SPDT, Form C, rated 10 A 115 V/5 A 230 V; 5 position BCD contact closure. Controls Single PID (optional); standard, pump pulser or time proportional. Outputs Two continuous, assignable, programmable 4 mA to 20 mA, or 0 mA to 20 mA outputs; isolated, max. load 600; Convertible from 1 VDC to 5 VDC or 0 VDC to 5 VDC. Communication Via RS485 bidirectional serial data port; require IC NetTM 2000 software. es-455-1.2 Page 8 www.iccontrols.com um-455-212
IC Controls INSTALLATION INSTALLATION Analyzer Mounting The conductivity sensor is typically supplied with at least a 1.5 m (5 ft) lead as standard. The 455 analyzer should be kept within the sensor lead length and mounted on a wall, ideally at eye level. Position the analyzer to allow the sensor, still connected to the analyzer, to be removed and the electrode tip placed in a beaker on the floor for cleaning or calibration. Assume the safest place for the beaker is on the floor the service person stands on. Horizontal separation between rows of analyzers should allow for electrode leads which need periodic replacement, and the electrical conduit. Controls recommends a minimum separation of 10 cm (4 in) between rows/columns. As standard, the 455 comes with four internal 0.43 cm (0.17 in) holes for surface mounting screws spaced 18.8 cm (7.41 in) wide and 8.8 cm (3.47 in) high. Case dimensions are 20 cm x 12 cm x 7.5 cm (w, h, d) or 7.87 in x 4.72 in x 2.75 in (w, h, d) as shown on drawing D4830022. Pipe mounting kit, option -8 for 5 cm (2 in) pipe, P/N A2500255, is shown on drawing D4950053. It may also be used to surface mount the analyzer by removing the 2 inch U bolts and using the holes in the mounting plate for wall studs (using customer-supplied studs). The mounting plate dimensions are 20.3 cm x 21.6 cm (8 in x 8.5 in) with elongated U bolt holes. Panel mounting kit, option -9, P/N A2500201, is shown on drawing D4950054. It requires a customer supplied panel cut-out, 20.6 cm (8.1 in) wide x 12.2 cm (4.8 in) high, with two 0.4 cm (0.15 in) screw holes centered 22.6 cm (8.9 in) apart and 6.1 cm (2.4 in) below top of cutout. dimensions are 24.1 cm x 15.9 cm (9.5 in x 6.25 in). IC The panel bezel Wiring Power for the 455 analyzer is 115/230 VAC ± 10%, single phase 50/60 Hz, and 0.25 A. Connections are made at TB400 inside the instrument enclosure; refer to drawing D5920093. The microprocessor requires a suitable ground to ensure stable operation. A power line with the third wire connected to earth ground should be adequate, however, a local earth rod may prove more fitting. There are three 2.0 cm (0.875 in) holes for 0.5 inch conduit in the bottom of the enclosure. IC Controls recommends that AC be brought in through the right-hand entrance for power and alarms; 4 mA to 20 mA and digital low voltage wiring be brought in through the center entrance, and sensor leads be passed through the left-hand entrance. Conduit should be flexible, watertight, and sealed using a gasket to maintain environmental integrity within the enclosure. Connect the two relay/alarm contacts; Alarm A: contact TB300 Alarm B: contact TB301 Connect the two isolated 4 mA to 20 mA outputs; Output 1: contact TB303 Output 2: contact TB304 um-455-212 www.iccontrols.com Page 9
INSTALLATION IC Controls Sensor Mounting It is recommended that the sensor be located as near as possible to the conductivity analyzer to minimize any effects of ambient electrical noise interference. Flow sensors can be in any orientation but should be mounted tip down at an angle anywhere from 15 degrees above horizontal to vertical. 15 degrees above horizontal is best because air bubbles will rise to the top and debris will sink, both bypassing the sensor. Submersion sensors should not be mounted where a lot of air bubbles rise in the tank, they will cause spikes in the conductivity readout. If an air bubble is allowed to lodge in the sensing tip, electrical continuity between the electrodes may be disrupted. Sensor Wiring The basic wiring scheme for all IC Controls’ conductivity sensors is shown in drawing D5920095, including a description of the 400 interface to the analyzer. This wiring scheme is intended for cable runs less than 20 m (65 ft) where electrical interference is low. This cable is available from IC Controls as P/N A9200000. All low-level sensor signals should be run through a dedicated conduit. Take care to route all signal wiring away from AC power lines in order to minimize unwanted electrical interference. installing sensor cable in conduit, use caution to avoid scraping or cutting the cable insulation - the resulting short of the cable’s internal drive shield will cause conductivity errors. Avoid twisting the sensor lead to minimize potential for broken wires. Ensure the sensor connections are clean and tight. When Instrument Shop Test Startup Note: For this test example, assume the conductivity sensor has a 1.0/cm cell constant. 1. Apply 115/230 VAC power to the analyzer. 2. Hook up the sensor via TB201 and remove orange protective cap. Keep for future use. 3. With the sensor dry and in air, the 455 conductivity analyzer should display a reading of 0.0 µS/cm ± 0.5 µS/cm. 4. Perform an “air” zero calibration; use wires to be field installed and allow 30 minutes warm-up time for the electronics to stabilize. 5. Run the “Std.” (span) calibration; place the sensor in 1000 µS/cm standard. The display should read approximately 1000 µS/cm ± 10 µS/cm. 6. To check for general performance, place the sensor in 100 µS/cm standard. The display should read approximately 100 µS/cm ± 5 µS/cm. 7. Before placing analyzer into operation, verify settings to ensure that they coincide with the intended setup. Refer to Appendix D: Default Settings section. For the 4 mA to 20 mA output, set high limit and low limit. 8. Set preference for temperature units as °C or °F in [CONF] [unit]. 9. Set desired input signal damping if known; default is 5 seconds. 10.Install password security, if desired. 11.The unit is now ready for field installation. Page 10 www.iccontrols.com um-455-212
IC Controls INSTALLATION NOTICE OF COMPLIANCE US This meter may generate radio frequency energy and if not installed and used properly, that is, in strict accordance with the manufacturer’s instructions, may cause interference to radio and television reception. It has been type-tested and found to comply with the limits for a Class A computing device in accordance with specifications in Part 15 of FCC Rules, which are designed to provide reasonable protection against such interference in an industrial installation. However, there is no guarantee that interference will not occur in a particular installation. If the meter does cause interference to radio or television reception, which can be determined by turning the unit off and on, the user is encouraged to try to correct the interference by one or more of the following measures: * Reorient the receiving antenna * Relocate the meter with respect to the receiver * Move the meter away from the receiver * Plug the meter into a different outlet so that the meter and receiver are on different branch circuits If necessary, the user should consult the dealer or an experienced radio/television technician for additional suggestions. The user may find the following booklet prepared by the Federal Communications Commission helpful: How to Identify and Resolve Radio-TV Interference Problems. This booklet is available from the U.S. Government Printing Office, Washington, D.C., 20402. Stock No. 004-000-00345-4. CANADA This digital apparatus does not exceed the Class A limits for radio noise emissions from digital apparatus set out in the Radio Interference Regulations of the Canadian Department of Communications. Le present appareil numérique n’ émet pas de bruits radioélectriques depassant les limites applicables aux appareils numériques (de la class A) prescrites dans le Règlement sur le brouillage radioélectrique édicté par le ministère des Communications du Canada. um-455-212 www.iccontrols.com Page 11
STARTUP IC Controls STARTUP Analyzer Start-up Tests 1. Install the model 455 analyzer according to the instructions in the Installation section. Verify power supply has been wired for proper voltage and instrument is suitably grounded. 2. Turn on flow at sample inlet or insert sensor in sample. 3. Power up the 455 analyzer. 4. The startup procedure will begin by alternately flashing [tESt] and [——] while performing the memory tests. 5. The analyzer will display in sequence the analyzer model number, in this case [455], and the program version number, eg. [2.10]. 6. The display test lights each of the implemented display segments in turn. At the same time, each of the LEDs will be lighted in turn. 7. If the analyzer passes all the tests, then the hardware is functioning properly, and the analyzer will proceed to display the conductivity reading. 8. If the analyzer displays [+Err], this indicates that the conductivity input is off-scale. The error LED will be lit as long as an input is off-scale. An off-scale error can indicate that the sensor is not in solution, is off-scale, or is not connected properly. If the error LED remains lit, press the ERROR key to see what errors have been detected by the analyzer. 9. After completing the above steps, the analyzer is now in normal operational mode. Analyzer settings and parameters can be viewed and/or changed at any time using the keypad. Refer to 455 Menus on page 3 to 5. Start-up Settings The 455 analyzer default assumes a sensor with a cell constant of 1.0/cm which is stored in its memory. By default, the analyzer displays conductivity. The cell constant of the sensor must match the cell constant stored in the analyzer memory. If a cell constant other than 1.0/cm is used, change the constant stored by the analyzer so that the analyzer will read properly. Temperature has a big impact on conductivity readings, typically 2% change per °C. temperature shift can produce a 50% error if the reading is not compensated. correction is 2% per °C (1.11% per °F). For high accuracy work and high purity water applications, IC Controls recommends that the user check the actual chemical rate and change the setting if necessary. A conductivity sensor's effective surface area can be changed by contact with the process. IC Controls recommends a calibration of the conductivity sensor to determine the effective cell constant. This procedure requires a conductivity standard from which the effective cell constant can be determined. A 25 °C The 455 default Page 12 www.iccontrols.com um-455-212
IC Controls EASY MENU EASY MENU The layout of the program is shown in the 455 Menus starting on page 3. Remembers Where You Were The analyzer remembers where SAMPLE is. The program also remembers which menu selections were used last and loops around the columns. The menu can be accessed using the arrow keys to find any parameter then press SAMPLE to return to the displayed reading. Then using the Right arrow key return to exactly where you were. The sample display is home base for the program. Home Base: Press Sample From anywhere in the menu, the SAMPLE key can be used to return to displaying conductivity. The program will safely abort whatever it was doing at the time and return to displaying the conductivity reading. The conductivity display is the default sample display for the analyzer. The analyzer’s inputs, conductivity and temperature, are arranged underneath each other at the left-hand side of the menu. Use the Up or Down arrow key to display each of the readings in turn. Illustration 6: Home base Display Features 1. The analyzer has a built-in timer which returns the program to displaying conductivity if no key is pressed for 15 minutes. This time-out has the same effect as pressing the SAMPLE key. If security has been enabled, then the time-out will change the access level back to 0 or 1 automatically which gives the user read-only access. appropriate password to go to a higher access level. 2. When the sample value is displayed, pressing the Left arrow key will show which of conductivity or temperature is displayed. Pressing Right arrow key displays the sample reading again. 3. Each input can be turned off and thereby effectively disappear from the menu if it is turned off in the configuration menu. configuration, refer to the Configuration of Program section. 4. The main sample, ie. the input that is displayed first when the SAMPLE key is pressed, can be changed. By default the main input is [cond]. Change the default in [CONF] [in] [dFLt]. Refer to the Configuration of Program section for further details. The user will have to enter an To change the Illustration 7: Main menu um-455-212 www.iccontrols.com Page 13
EASY MENU IC Controls Arrow Keys The four arrow keys on the keypad are used to move around in the menu. Example: Press SAMPLE to make sure that display is at home base. Press the Right arrow key. One of the prompts in the column starting with [out] will be displayed. Use the Up or Down arrow keys to display the prompt above or below. If the prompt at the top or the bottom is displayed, the program will loop around. Press the Up or Down key until [AL] is displayed. Press the Left key to return to the sample display. Press the Right key again and [AL] will be displayed. AUTO and MANUAL Keys The AUTO and MANUAL keys are used to implement the alarm override feature on analyzers that do not use the PID option. Refer to the Alarm Override heading in the Alarm Functions section for a description of these key functions. Illustration 8: Analyzer keypad Standby Mode In standby, the alarms will not function and the 4 mA to 20 mA outputs will go to 4.00 mA. When SAMPLE is pressed, the inputs will show [StbY]. The analyzer will not resume normal operations until the analyzer is taken out of standby. While in standby, the entire menu and all of the settings are accessible to the operator as before. None of the settings will take effect until the analyzer is returned to normal operation. The standby feature is protected by security level 2. Illustration 9: Standby menu Page 14 www.iccontrols.com um-455-212
IC Controls EDIT MODE EDIT MODE Edit mode is used to change a numeric value or to select between different options. Values and settings which can be edited are identified by the darker shading in the menu. Any frame which has a white background cannot be modified. Editing by Selecting a Setting Editing a value is like picking an option from a list - only one item on the list can be seen at a time. To change the setting, press ENTER to go into edit mode. The display will start blinking. Use the Up or Down arrow key to switch between the possible options and then press ENTER again to accept the new setting and leave edit mode. Example: Turn alarm A off. From the menu, select [Al] [Al.A] [ON.OF]. The analyzer will now display either [ON] or [OFF], which are the two choices. To change the setting, press ENTER to go into edit mode. The display will start blinking. Use the Up or Down arrow key to switch between the possible options. When [ON] is displayed, press ENTER again to accept the new setting and leave edit mode. Summary of Key Functions in Edit Mode Enters edit mode. The entire display or a single digit will blink to indicate that the analyzer is in edit mode. Press the ENTER key again to leave edit mode and accept the new value. Adjusts blinking digit upward or selects the previous item from the list. If a 9 is displayed then the digit will loop around to show 0. Adjusts blinking digit downward or selects the next item from the list. If a 0 is displayed then the digit will loop around to show 9. Numeric values only: move to the right one digit. If blinking is already at last digit, the display will loop to the ± sign on the left. Numeric values: move left one digit. If blinking is at the ± sign then blinking goes to last character. Settings: restore the initial value if it was changed. Otherwise leaves edit mode without doing anything. Illustration 10: Edit keys um-455-212 www.iccontrols.com Page 15
EDIT MODE IC Controls Temperature °C or °F By default, the analyzer will use metric units. This means that temperature will be displayed using degrees Celsius and that the prompt for the temperature input will be [°C]. The analyzer can also use imperial units. For imperial units, temperature will be displayed using degrees Fahrenheit and the prompt for the first temperature input will be [°F] instead of [°C]. In this instruction manual, the temperature input is always identified as [°C] throughout the menus. To select imperial units for the analyzer, select [unit] from the configuration menu, then go into edit mode and change the [°C] setting to [°F]. Input Damping The conductivity and temperature measurements can be damped to provide the user with a means to alleviate rapidly-varying or noisy signals. The available damping range is 3 s to 99 s; with 0, there would be no damping and each reading the analyzer made would be used to directly update the display and 4 mA to 20 mA output. The factory default of 5 s adds the next four seconds worth of readings to the first and divides by five; this provides a fast response. Selecting 99 s adds the readings for 99 s and divides by 99, providing smooth damping out of turbulent readings. Any selection between 3 s and 99 s can be made. Select [CONF] [in] from the menu. Use the up or down arrow key to select the input to be adjusted, then select the [dA] frame. Press ENTER to edit the input damping to the selected seconds. Press ENTER to leave edit mode. Real-Time Clock The analyzer clock is used for internal date/time stamping of system events and the internal data log. Both the system events and the internal data log are accessed using the IC Net Intelligent Access Program, which is available as option -35. Analyzers purchased with option -34 have a real-time clock which will maintain the correct time and date even when the analyzer power is turned off. Page 16 www.iccontrols.com um-455-212
IC Controls CONDUCTIVITY MEASUREMENT CONDUCTIVITY MEASUREMENT What is conductivity? Electrical conductivity is a measure of the ability of a solution to carry a current. Current flow in liquids differs from that in metal conductors in that electrons cannot flow freely, but must be carried by ions. Ions are formed when a solid such as salt is dissolved in a liquid to form electrical components having opposite electrical charges. For example, sodium chloride separates to form Na+and Cl-ions. All ions present in the solutions contribute to the current flowing through the sensor and therefore, contribute to the conductivity measurement. Electrical conductivity can therefore be used as a measure of the concentration of ionizable solutes present in the sample. Conductivity Units Electrical resistivity uses the unit of ohm meter or Ω⋅m. Electrical conductivity is the reciprocal of electrical resistivity. Rather than use the units Ω−1⋅m−1, in 1971 the unit “siemens” (symbolized by the capital letter S) was adopted by the General Conference on Weights and Measures as an SI derived unit. The unit for electrical conductivity becomes siemens per meter. The siemens unit is named after Werner von Siemens, the 19th century German inventor and entrepreneur in the area of electrical engineering. MEASUREMENT UNITS resistance ohm conductance siemens, mho resistivity ohm conductivity siemens/cm Table 1 Electrical conductivity measuring units North American practice continues to see the use of unit mho/cm to measure conductivity, where the unit “mho” is a reciprocal ohm. The word “mho” is the word “ohm” spelled backwards. Because of the history of conductivity measurements in micromho/cm and millimho/cm, it is common to see these measurements translated to microsiemens/cm and millisiemens/cm because there is a one-to-one correspondence between these units. What is a Cell Constant? The volume of the liquid between the electrodes must be exact so that the analyzer can determine how much current will flow through a known amount of liquid. The controlled volume of a conductivity sensor is referred to as its cell constant. A cell constant of 1.0/cm describes a cell with an enclosed volume equal to 1.0 cm3. A cell constant of 1.0/cm is the easiest constant to work with as conductivity describes the amount of current flow per centimeter. A cell constant is usually chosen to produce a steady flow of current between the two electrodes. Moderate current and voltage levels can usually be achieved by selecting the proper cell constant. A high cell constant is used for solutions with high conductivity, and a low cell constant is used for solutions with low conductivities. um-455-212 www.iccontrols.com Page 17
CONDUCTIVITY MEASUREMENT IC Controls Measurement Range The 455 conductivity analyzer is an auto-ranging analyzer. The input circuit has four ranges and will switch automatically to avoid going off-scale. The range, e.g. 0 µS/cm to 10,000 µS/cm, is determined by the gain used by the analyzer plus the cell constant of the sensor. Ranges in this manual are based on a cell constant of 1.0/cm. The analyzer gains are 100, 1,000, 10,000, and 100,000. Table 2, Guide to Cell Constants and their Usable Ranges, indicates maximums for the ranges using available cell constants. Manual Range Switching By default, the analyzer is in auto-range mode. To change to manual mode, go to configuration menu; [CONF] [in] [cond] [AUtO], edit from [YES] to [no]. The range can now be manually adjusted by changing the setting in [CONF] [in] [cond] [rANG]. Cell Constant and Range Changing the cell constant to 0.01/cm, achieves ranges of 1 µS/cm, 10 µS/cm, 100 µS/cm, and 1,000 µS/cm while 20/cm achieves 2,000 µS/cm, 20,000 µS/cm, 200,000 µS/cm, and 2,000,000 µS/cm. If the sensor is replaced with a sensor having a different cell constant, the cell constant needs to be changed in memory. Select [CONF] [cond] [CELL] [1] from the menu, then edit the cell constant. The program will allow cell constants between 0.001/cm and 99.99/cm to be entered. Guide to Cell Constant Usable Ranges CELL CONSTANT DESIGN RANGE LOWEST RANGE HIGH RANGE OVER-RANGE * cm-1 µS/cm µS/cm µS/cm µS/cm 0.01 0 to 10 0 to 1 0 to 100 0 to 1 000* 0.02 0 to 20 0 to 2 0 to 200 0 to 2 000* 0.1 0 to 100 0 to 10 0 to 1 000 0 to 10 000* 0.2 0 to 200 0 to 20 0 to 2 000 0 to 20 000* 0.5 0 to 500 0 to 50 0 to 5 000 0 to 50 000* 1.0 0 to 1 000 0 to 100 0 to 10 000 0 to 100 000* 2.0 0 to 2 000 0 to 200 0 to 20 000 0 to 200 000* 5.0 0 to 5 000 0 to 500 0 to 50 000 0 to 500 000* 10.0 0 to 10 000 0 to 1 000 0 to 100 000 0 to 1 000 000* 20.0 0 to 20 000 0 to 2 000 0 to 200 000 0 to 1 000 000* 50.0 0 to 50 000 0 to 5 000 0 to 500 000 0 to 1 000 000* * Note: use over-range with caution. Some sensor designs may limit when used on over-range and may not reach the maximum shown. Table 2 Cell constant usable ranges Page 18 www.iccontrols.com um-455-212
IC Controls CONDUCTIVITY MEASUREMENT Displayed Conductivity Units When the analyzer is reading conductivity as microsiemens and the conductivity goes above 9,999 µS/cm, the analyzer shows [+Err] instead of a reading. Internally, the analyzer is still calculating the conductivity reading correctly, but it cannot be displayed properly. When this condition occurs, CA1.9 will appear in the error menu. Conductivity can be displayed using either µS/cm or mS/cm units where; 1mS?cm?1000µS?cm Normally it is best to display the conductivity using µS/cm units for maximum resolution and to switch to millisiemens per centimeter, mS/cm, only if the sample exceeds 9,999 µS/cm. By changing the display units a reading of 9 000 µS/cm would change to 9.00 mS/cm. By default, the analyzer reads in µS/cm. To change the displayed conductivity units, edit the setting in [cond] [unit]. The options are [1E-3] for mS/cm (1E-3 is scientific notation for milli or thousandth) and [1E-6] for µS/cm (1E-6 is scientific notation for micro or millionth). Illustration 11: Units for conductivity input um-455-212 www.iccontrols.com Page 19
CONDUCTIVITY CALIBRATION IC Controls CONDUCTIVITY CALIBRATION The conductivity loop is usually calibrated using standard conductivity solutions. Alternatively, grab- sample analysis on a previously calibrated laboratory reference conductivity meter can be used. Overall system accuracy is maintained by calibrating the sensor and analyzer together in a standard close to the expected sample concentration. Calibration determines the effective cell constant of the conductivity sensor. The cell constant is affected by the shape of the sensing surface and electrode surface characteristics. The effective cell constant will change over time as deposits form, and anything else that affects either the controlled volume or the effective electrode surface area. The 455 features an output hold. Output hold goes into effect as soon as a calibration is started. The output hold will stay in effect until; a) SAMPLE key is pressed b) no key is pressed for 15 minutes c) the power is interrupted and analyzer reboots The output hold feature avoids false alarms and erratic signal output caused by a routine calibration. Illustration 12: Conductivity menu Selecting a Standard Conductivity standards provide the simplest and most accurate method for calibrating the 455 analyzer. The analyzer has been programmed to recognize the three standards most commonly used for calibration; 100 µS/cm, 1 000 µS/cm, and 10 000 µS/cm at 25 °C (77 °F). Simply place the sensor in the standard and the analyzer will use the correct temperature adjusted value for the standard. Temperature dependence of standards To achieve greater accuracy, the temperature compensated values for the 100 µS/cm, 1 000 µS/cm, and 10 000 µS/cm conductivity standards are calculated by the analyzer. compensation has been selected, then the manual temperature compensation set-point is used as the standard temperature. Other standards or custom standards If a “custom value” conductivity standard is to be used, press SELECT [Cal] SELECT [100], then ENTER to edit to the known value. Values entered this way should be the known value at the current temperature as they are not temperature-compensated by the analyzer. If manual temperature Page 20 www.iccontrols.com um-455-212
IC Controls CONDUCTIVITY CALIBRATION Calibration Using Standards Select a conductivity standard with a concentration that is close to the expected sample concentration. A second conductivity standard can be used to verify that the conductivity sensor is responding properly. This second standard can be any value but typically 10% of the first standard works well giving checks at 100% and 10% of range. 1. Obtain calibration supplies such as a graduated cylinder or beaker which is large enough to submerse the conductivity sensor, plus distilled or deionized water in a squeeze bottle for rinsing, or an IC Controls calibration kit. 2. Remove the conductivity sensor from the process and inspect the sensor for any deposits. If the sensing surface is coated, clean the sensor before proceeding. Maintenance section. Rinse the sensor cell area with distilled water. 3. Rinse the graduated cylinder or beaker with some of the standard, then pour the selected higher conductivity standard into the graduated cylinder or beaker. 4. Immerse the sensor and ensure the sensor electrode area is completely submerged. If the sensor has vent holes, then the sensor must be submerged below the vent holes and there must be no air bubbles inside. Illustration 13: Conductivity calibration Refer to the Sensor Important: a) Air bubbles inside the controlled volume area of the conductivity sensor cause major upsets to ion flow and result in large errors in the reading. b) If the analyzer is not reading on-scale, it may be because the automatic ranging is “OFF” and the wrong range has been manually selected. Refer to Configuration of Program section. 5. Select [cond] [CAL] [std] from the menu, and press SELECT. Edit the displayed standard value to that of the standard you are using in mS/cm or ?S/cm depending on the setting of [cond] [unit]. 6. Press SELECT to start the calibration. The analyzer will display a flashing concentration reading. From here on the calibration process is automatic - the analyzer will wait until the reading has stabilized, then calculate the cell constant using the temperature-compensated value of the conductivity standard. The display stops blinking and shows the conductivity of the standard upon completion of calibration. NOTE: a) It is possible to repeat or restart the calibration at any time. Simply press CANCEL, then SELECT to restart or to repeat the calibration. b) If a problem is detected during calibration, a caution or error message will be displayed. Refer to Error Messages section. 7. The conductivity sensor and analyzer pair are now calibrated. Used conductivity standard should be discarded because exposure to air and contamination causes the conductivity value of standards to change. um-455-212 www.iccontrols.com Page 21
CONDUCTIVITY CALIBRATION IC Controls NOTE: a) You can inspect and/or manually adjust the cell constant by selecting [cond] [CELL] [1] from the menu. b) The sensor condition can be verified by measuring the concentration of a second standard. Rinse the sensor surface with deionized water and then measure the concentration of the second standard (refer to step 4). If the analyzer reads correctly, the sensor condition is good. If the analyzer does not read correctly, the sensor may not be responding properly and may need to be cleaned. c) It is possible that electrical pickup may cause an erroneous reading, such as an elevated zero with the sensor in air. Normally an “air calibration” for zero is only needed if the sensor has been replaced. CAUTION: To get an accurate air calibration, the sensor must be completely dry for zero air calibration. Calibration by Grab-Sample The grab-sample technique is quicker and easier if the sensor is not easily accessible. This procedure describes how to calibrate the analyzer without removing the sensor out of the process. The procedure requires that the sample be measured using a second analyzer. Typically a laboratory analyzer is used to determine the actual conductivity of the sample. 1. Obtain the following materials: a) a second conductivity analyzer b) sensor of known constant c) calibration standards d) a clean beaker for taking a sample e) a calculator 2. Calibrate the second conductivity unit. 3. Record the cell constant of the sensor being used with the model 455. The cell constant is displayed by pressing SAMPLE, and then selecting [cond] [CELL] [1] from the menu. 4. Draw a sample from the process. In order for the procedure to work properly, the sample taken must be representative of the sample being measured by the 455 conductivity analyzer. 5. Record the conductivity and temperature of the sample as displayed by the 455 conductivity analyzer. 6. Measure the conductivity of the sample using the second conductivity analyzer and record the conductivity reading. For accurate results, the sample must be at the same temperature and the analyzers must use the same temperature compensation method. Page 22 www.iccontrols.com um-455-212
IC Controls CONDUCTIVITY CALIBRATION 7. Calculate the new cell constant to be entered into the 455 analyzer using the following formula: newcellconstant?labreading field reading?old cell constant For example, if the 455 analyzer is reading 820 ?S/cm, the cell constant (from step 2) is 1.0/cm, and the reading from the second method is 890 ?S/cm, then the new cell constant becomes: newcell constant?890 S?cm 820 S?cm?1.0?cm?1.09?cm 8. Adjust the cell constant to the new value, e.g. 1.09/cm, as in the example. The cell constant is adjusted by selecting [cond] [CELL] [1] from the menu. Press ENTER to get into edit mode, then adjust the displayed value. 9. The analyzer should now read accurately. Air Zero Calibration It is not necessary to repeat an “Air” calibration every time a regular calibration is performed. An air calibration should be performed anytime a new sensor is installed. When a sensor is in air, the conductivity measured by the sensor is expected to be zero. It is not uncommon to find some small conductivity signal with the dry sensor in air or even with no sensor connected at all. measurement may be attributed to background noise, lead wire pickup (antenna effect) or grounding problems. The air calibration is designed to subtract the small errors of this interference signal from the real measurement in order to give a true zero reading. 1. Perform a zero calibration any time a new sensor is installed. 2. Ensure that the sensor is dry before zeroing. The analyzer should be reading a low conductivity value. 3. From the menu select [cond] [Air] and press SELECT. The analyzer will show a flashing [do]. 4. When the sensor is ready to be calibrated, press ENTER. 5. Press SAMPLE. With the sensor still dry and in air, the conductivity should read 0.00 ?S/cm. Potential problem: When you press ENTER with the flashing [do] displayed, the analyzer will not perform the zero calibration but will show the current range number, eg. [rnG.2]. For a zero calibration to be successful, the analyzer needs to be on range 4, the range with the highest gain. If the analyzer is not on range 4, the sensor is likely not in air, or is wet. Correct the sensor situation and try again. This um-455-212 www.iccontrols.com Page 23
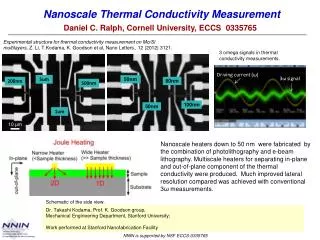
CONDUCTIVITY CALIBRATION IC Controls Temperature Compensation (TC) Ionic movement, and therefore conductivity measurement, is directly proportional to temperature. The effect is predictable and repeatable for most chemicals, although unique to each chemical. The effect is instantaneous and quite large, typically between a 1% to 3% change per degree Celsius, with reference to the value at 25 °C. Many industrial applications encounter fluctuating temperature and thus require automatic compensation. IC Controls' conductivity sensors include a temperature compensator built into the sensor. The 455 analyzer uses a linear temperature compensation method with a default setting of 2%/°C. 2%/°C is an average value commonly found in many water samples containing some dissolved solids. Over wide temperature spans, e.g. 0 °C to 100 °C, the temperature compensation factor often does not remain constant making it difficult to obtain a good value. If the temperature curve of the sample is known, set the linear TC constant to match the curve in the temperature range the analyzer will be measuring in. Illustration 14: Typical temperature response Manual Compensation If automatic temperature compensation is not available, manual temperature compensation may be used. If the temperature of the sample is constant, set the manual TC temperature to reflect the process temperature. If the process temperature varies or is unknown, the default temperature of 25 °C or 77 °F is normally used. TC for High Purity Water Very low conductivity water or “high purity” water is highly temperature-dependent. The presence of trace impurities such as acids, salts, and bases each dramatically and uniquely affect the TC curve required. Page 24 www.iccontrols.com um-455-212
IC Controls CONDUCTIVITY CALIBRATION Setting the Linear TC Constant Depending on the chemical involved, the value for temperature compensation will vary. The values change from approximately 1% to 3%. Table 3 is a general guide for typical applications. The formula for the temperature-corrected conductivity value is: conductivity?Kcell R 1 ?100 ? T?25 where conductivity is the temperature-compensated reading in siemens/cm; Kcell = cell constant in cm-1 , typically in the range 0.01/cm to 50/cm; R = measured resistance in ohms; α = temperature compensation factor as % change per °C, typically close to 2.0; T = current temperature in degrees Celsius. 1 The linear TC constant is normally displayed as percent change per degree Celsius. If the units for temperature are changed from °C to °F, then the linear TC constant automatically changes to percent change per degree Fahrenheit. Some chemicals that are frequently diluted for use have non-linear temperature compensation requirements. As a result, IC Controls has provided special program versions with TC curves in the memory for some common chemicals used in industry such as NaOH (455-21), H2SO4 (455-22), HCl (455-23), and NaCl (455-24), that read out in % concentration; plus TDS, Total Dissolved Solids (455-25), resistivity (455-26), and very low conductivity or high purity water (455-63). Substance % change per °C 1.0% to 1.6% per °C acids 1.8% to 2.2% per °C 2.2% to 3.0% per °C bases salts 2.0% per °C neutral water Table 3Typical temperature response Illustration 15: Non-linear temperature um-455-212 www.iccontrols.com Page 25
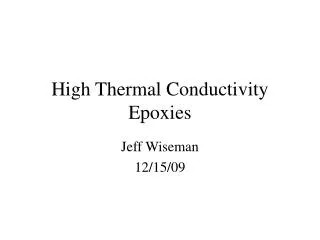
CONDUCTIVITY CALIBRATION IC Controls Conductance Data for Commonly-Used Chemicals Examples of conductance of various materials with changing concentration are shown below. Sodium Hydroxide (NaOH) also exhibits quite variable temperature related rates of concentration change. It is clear from the graph that both Sulfuric Acid, H2SO4, and Nitric Acid, HNO3, have unusual ’conductivity’ vs. '% by weight' relationships as well. It clearly shows that there is no “conductivity constant” between chemical combinations. Illustration 16: Conductivity (µS/cm) vs. Chemical concentration Page 26 www.iccontrols.com um-455-212
IC Controls ERROR MESSAGES ERROR MESSAGES Detected errors and/or cautions can be displayed by the analyzer. From the main menu select [Err]. If there are no error or caution messages, [NONE] will be displayed, otherwise scroll through the error list using the Up and Down arrow keys. Errors and cautions cannot be removed from this list directly; each error or caution will be removed automatically when appropriate, eg. errors associated with improper calibration will be cleared after a successful calibration. Error messages are numbered. identified as [En.e] where n is the input number and e is the error number. Messages 6 through 9 are less serious and are identified as cautions instead, eg. [CAn.e]. Off-scale errors for conductivity are not numbered and are identified as [+Err] and [-Err], depending on whether the input is at the top or the bottom of the scale. The off-scale error is displayed instead of the sample reading and does not show up in the error menu with the numbered error messages, if any. Error message indicators can be annoying when one has already been made aware of them. A method has been provided to turn off the error LED and the fault alarm for a particular error message. Refer to the heading Acknowledging an Error Message below for the exact procedure. The error LED will remain on as long as there is an unacknowledged error or caution message or as long as any input is off-scale. Each source of error must be removed or acknowledged before the error LED will go off. Errors 1 through 5 are input / source input number for error and caution messages 1 2 Conductivity Temperature Alarm A Alarm B 7 8 Table 4: Input numbers Acknowledging an Error Message Select [Err] from the main menu. Use the Up or Down arrow key until the error message to be acknowledged is displayed. Errors are displayed with either a positive (+) sign or a negative sign (-) in front. The + sign is used to indicate an active or unacknowledged error, the - sign indicates an inactive or acknowledged error. Acknowledging the error will change the sign from + to -. Press ENTER to go into edit mode. The + or - sign will be flashing. Use the Up or Down arrow key to change the sign, then press ENTER again. An acknowledged error message is cleared for one occurrence of the error only. If the error reappears, the sign changes from - to + and the error message must be acknowledged again. um-455-212 www.iccontrols.com Page 27
ERROR MESSAGES IC Controls Error Messages for Conductivity Error Description Causes Solutions Check electrode and setup until stable reading is achieved; redo calibration. E1.1 Electrode has not stabilized after 5 minutes of calibration. Poor electrode performance; sample is not stable; interference. E1.2 Effective cell constant would be less than 0.001. Previous cell constant retained. Incorrect or contaminated standard used for calibration. Redo calibration using correct or fresh standard. Refer to Troubleshooting section. E1.3 Effective cell constant would be greater than 100. Previous cell constant retained. Incorrect or contaminated standard used for calibration. Redo calibration using correct or fresh standard. Refer to Troubleshooting section. E1.4 Range- switching error. Gap between ranges. Electronic calibration adjustment needed. Turn automatic range-switching off; manually switch between ranges. E1.5 Temperature compensator (TC) is off- scale. Sample outside of TC operating range of -10 °C to 210 °C. Use manual temperature compensation. Check TC connections or install TC. E1.6 Input is at maximum. The internal A/D (analog-to- digital) converter is at the top of the scale. The analyzer cannot measure higher at this range. If conductivity input is in manual range switching, change to automatic range switching so that the analyzer can automatically shift up to the next input range. If conductivity input is already on range 4, then the analyzer is at the limit of it’s measuring capability. Use a different sensor with a higher cell constant. Linear temperature compensation constant (LTCC) is set to high. Determine a lower LTCC to use to correctly compensate for temperature. A typical value is 2.00 (for 2% change per °C). E1.7 Conductivity shows negative value. Page 28 www.iccontrols.com um-455-212
IC Controls ERROR MESSAGES Error Description Causes Solutions CA1.9 Display shows OFL.d. Conductivity value too high for the LCD display; eg. the display units are µS/cm and the conductivity is higher than 9,999 µS/cm. Change the display units from µS/cm to mS/cm in [cond] [unit]. 0.00 No conductivity measurement. Sensor resistance has saturated the measuring capability of the analyzer. Open circuit; sensor not connected. Sensor with different cell constant should be used. Error Messages for Temperature Error Description Causes Solutions E2.1 Temperature reading off- scale; less than -10 °C. Temperature is lower than -10 °C. Verify process and sensor location. Electronic calibration needed. Follow procedure in Hardware Alignment section. E2.2 Temperature reading off- scale; greater than 210 °C. Temperature compensator (TC) not attached. Attach temperature compensator. Turn off temperature input. Follow Input On/Off Switch procedure in Software Configuration section. Connect resistor to TC terminals to simulate a constant temperature. Refer to Hardware Alignment section. Temperature is higher than 210 °C. Verify process and sensor location. Electronic calibration needed. Follow procedure in Hardware Alignment section. Caution Messages for Alarms Caution Number Description CA7.6 Alarm A, High alarm CA7.7 Alarm A, Low alarm CA7.8 Alarm A, Deviation alarm CA7.9 Alarm A, Fault alarm CA8.6 Alarm B, High alarm CA8.7 Alarm B, Low alarm CA8.8 Alarm B, Deviation alarm CA8.9 Alarm B, Fault alarm um-455-212 www.iccontrols.com Page 29
SENSOR INSTRUCTIONS IC Controls SENSOR INSTRUCTIONS Preparation for use 1. Moisten the sensor body with tap water and remove the lower plastic storage cap. Keep the storage cap for future use. Rinse the exposed conductivity elements with tap water. 2. For first time use, or after long term storage, immerse the tip of the sensor in a conductivity standard for 30 minutes. This wets the conductivity electrodes and prepares them for stable readings with test solutions. NOTE: IC Controls sensor’s are shipped dry. These electrodes are often ready for use immediately with a typical accuracy of ± 2% conductivity without calibration. It is recommended that the sensor be soaked in standard plus calibrated using an appropriate conductivity standard in order to achieve optimal results. Calibration for Conductivity Overall system accuracy is maintained by calibrating the sensor and analyzer together in a concentration close to the expected sample concentration. The cell and analyzer can generally be calibrated in two of four typical ranges: 0 µS/cm to 100 µS/cm, 0 µS/cm to 1 000 µS/cm, 0 µS/cm to 10 000 µS/cm, and 0 µS/cm to 100 000 µS/cm. IC Controls has available conductivity calibration kits which conveniently package all necessary calibration supplies. These kits are available as P/N A1400051 (low conductivity; cell constants 0.01/cm and 0.02/cm), P/N A1400052 (medium conductivity; cell constants 0.1/cm to 5.0/cm) and P/N A1400053 (high conductivity; cell constants 10/cm to 50/cm). Where to Perform Conductivity Calibrations A suitable place to conduct a calibration is at a counter or bench with a sink in an instrument shop or laboratory. However, IC Controls' conductivity calibration kits are kept small and portable so that they can be taken to installation sites, together with a bucket of water (for cleaning/rinsing) and a rag or towel (for wiping/drying). NIST Traceable IC Controls QC’s manufactured conductivity standards using NIST (National Institute of Standards and Technology) materials. Certificates of traceability to NIST are available as P/N A1900333. Sensor Storage Short term: Rinse the sensor electrodes in deionized water, allow to dry and store dry. Long term: Rinse the sensor electrodes in deionized water, allow to dry, cover sensor tip with the plastic shipping cap and store dry. Monthly Maintenance A monthly maintenance check is recommended by grab sample calibration since the sensor is typically installed in the process and not easy to remove. Whenever possible, calibration using a conductivity standard close to the process conductivity value is suggested. Follow the appropriate calibration procedure in ConductivityCalibration section. Keep a log of the cell constant at each monthly calibration. Page 30 www.iccontrols.com um-455-212
IC Controls SENSOR INSTRUCTIONS Yearly Maintenance Follow the monthly maintenance procedure. Check the cell constant log. If the cell constant has changed more than 20% over the past year, it may need to be chemically cleaned - follow the Chemical Cleaning of Sensor procedure. O-rings and teflon-sealing ferrules should be replaced on conductivity sensor models 402, 403, 414, and 425. The condition of electrical connections in 400 junction boxes should be examined for signs of corrosion and tight connections; replace if corroded. The condition of the safety cables on model 403 sensors should be examined for rust or bent mounting screws. Replace if deterioration shows. Restoring Sensor Response Mechanical Cleaning of Sensor The sensor will require cleaning if sludge, slime, or other tenacious deposits build up in the internal cavities of the sensor. Wherever possible, clean with a soft brush and detergent. General debris, oil films and non-tenacious deposits can be removed in this way. For flat-surface sensors, use a potato brush and a beaker or bucket of water with a good liquid detergent. Take care not to scratch the electrode surfaces. Internal cavities of standard sensors can be brushed with a soft ? inch diameter brush. Plastic body sensors should be washed using a soft cloth ensuring all wetted areas are cleaned. This will return their appearance to like-new condition and remove sites for buildups to occur. Check the sensor calibration against a conductivity standard and calibrate if necessary. If the sensor is still not responding properly, proceed to the Chemical Cleaning of Sensor procedure, otherwise, return the sensor to the process. Chemical Cleaning of Sensor Obtain a supply of IC Controls’conductivity sensor cleaning and conditioning solution, P/N A1100005, or as available in conductivity chemical cleaning kit P/N A1400054. NOTE 1:A suitable place to do chemical cleaning is at a counter or bench with a laboratory sink with a chemical drain where waste is contained and treated before release. NOTE 2: IC Controls’kits are kept small and portable so that they can be taken to installation sites, together with a bucket of water (for rinsing) and a rag or towel (for wiping/drying). Waste materials, particularly acid leftovers, should be returned to the laboratory sink for disposal. CAUTION: Use extra caution when handling cleaning solution as it contains acid. Wear rubber gloves and adequate facial protection when handling acid. Follow all P/N A1100005 MSDS safety procedures. a) Set up the cleaning supplies where cleaning is to be performed. Lay out the sensor cleaning brush, syringe, cleaning and rinse solutions, plus the beakers and sensor if already at hand. NOTE: Ensure your cleaning solution beaker is on a firm flat surface since it will contain acid. b) Remove the conductivity sensor from the process and examine it for deposits. cleaning brush with tap water to loosen and flush away any deposits within the cell measurement area. Detergent can be added to remove oil films and non-tenacious deposits. Hard scales and other tenacious deposits may require chemical cleaning. Use the sensor um-455-212 www.iccontrols.com Page 31
SENSOR INSTRUCTIONS IC Controls c) CHEMICAL CLEANING - Fill a beaker ¾ full of cleaning and conditioning solution P/N A1100005, or for flow-through sensors with internal passages, seal one end to form a container inside the sensor body. d) Lower the conductivity cell into the center of the beaker until the top hole is submerged, or pour the solution in until the flow sensor is full. e) Keep removing and re-immersing the sensor until the sensor electrodes appear clean. Stubborn deposits can be worked on with the brush and syringe to squirt cleaner into hard to reach areas. CAUTION: Use great care when brushing and squirting acid. Wear rubber gloves and facial protection. f) Rinse the cleaned sensor thoroughly in tap water and squirt with deionized water to rinse before calibrating. g) Check the sensor against a conductivity standard near full scale. If the sensor is still not developing the proper cell constant ± 5% (or reading near the standard value), clean again, proceed to troubleshoot or replace the sensor. h) A clean, rinsed and dried conductivity sensor should read near zero in air. troubleshoot the sensor, wiring, and analyzer. If the sensor cannot be returned to good condition, it may need to be replaced. The cell constant, as calculated by the analyzer, should be within 25% of the original or intended value stamped on the sensor. NOTE: If none of the above procedures succeed in restoring your sensor response, it is near the end of its useful life and should be replaced. Alternatively, available acids can be used such as nitric acid, hydrochloric acid, or sulphuric acid. Nitric acid is preferred as it has no chlorides to corrode stainless steel. Acid concentrations between 0.5% acid and 10.0% acid (approximately 50% dilution of concentrated acid) can typically be used, depending on the severity of the application. Illustration 17: Chemical cleaning If it does not, Page 32 www.iccontrols.com um-455-212
IC Controls 4 mA TO 20 mA OUTPUT SIGNALS 4 mA TO 20 mA OUTPUT SIGNALS Two assignable 4 mA to 20 mA output channels are provided. The user may configure the analyzer to determine which input signal will be transmitted by each 4 mA to 20 mA output channel. Each output channel can be independently configured to transmit a conductivity or a temperature signal. The output channels independent of each other. output channel has a separate on/off switch and adjustable low and high span (or scale) adjustments. makes it possible, for example, to transmit two conductivity signals, each using separate adjustments. To adjust the output span or output window for temperature signals, correspond to the low end of the scale or 4 mA output, and set [HI] to correspond to the high end of the scale or 20 mA output. automatically scale according to the new settings. function Each This high and low conductivity set or to [LO] The analyzer will the output Illustration 18: Output menu Reversing the 4 mA to 20 mA Output The low scale setting will normally be lower than the high scale setting. It is possible to reverse the output or "flip the window" by reversing the settings of the low and high scale. Simulated 4 mA to 20 mA Output Select [cur] from the output menu to display the output current in mA that is presently being transmitted by the output signal. The display will be updated as the output signal changes based on the input signal and the program settings. From here, one can watch the output respond to the change in the input signal. This is useful for verifying program settings and for testing the hardware calibration. To simulate a different 4 mA to 20 mA output signal, press ENTER to access edit mode. Edit the displayed mA value to display the desired output needed for testing the output signal. Press ENTER to select the displayed value. The output signal will be adjusted to put out the desired current. This process can be repeated as often as necessary. The output signal is held at the displayed level until the program leaves this part of the menu. um-455-212 www.iccontrols.com Page 33
4 mA TO 20 mA OUTPUT SIGNALS IC Controls Units for Outputs The output menu will be using different units for its settings, depending on the input selected. Select [unit] from the output menu to display the units in use for this output. The [unit] setting affects the LO and HI settings. For conductivity, the [unit] selection can be set to[1E-6] for microsiemens, ?S/cm, or [1E-3] for millisiemens, mS/cm. For temperature, the [unit] selection can be set to [?C] for degree Celsius, or [?F] for degree Fahrenheit. Decimal Places for Conductivity The number of decimal places for high and low conductivity output can be adjusted to 0, 1, or 2 decimal places. Select [cond] [dEc] from the menu. Automatic Range Switching Automatic range switching capability of the 4 mA to 20 mA output. An application could track the conductivity input from 0 mS/cm to 500 mS/cm. When the conductivity level drops below about 50 mS/cm, a typical recorder would be able to show very little resolution (refer to illustration 20). With automatic range switching in effect for output 1, the output will adjust automatically over 4 ranges, moving from range 1 which is 100% of full scale to range 4 which is 0.1% of full scale. This means that with a full-scale setting of [HI] = 500 mS/cm, the output will automatically switch down to 0 mS/cm to 0.05 mS/cm or 0 µS/cm to 50 µS/cm on the fourth range. The actual numbers depend on the setting of the [HI] value and is user-adjustable. A hysteresis is built into the output logic to avoid having the output switch between ranges too frequently, thereby painting the chart recorder. The output will not switch downscale until the output reaches 9.5% of the current scale. The output will switch upscale again when the output reaches 100% of the current scale. Enabling Automatic Range Switching Only output 1 has auto-range available. From the menu select [out] [out1] [ArnG], then edit the setting to show [YES]. With auto-range enabled, the range currently being used can be determined by selecting [out] [out1] [rnG] from the menu. Example of Range Switching Illustration 19 shows the effect of using automatic range switching on the 4 mA to 20 mA output. Illustration 20 shows the conductivity level decreasing with resolution at the low levels. The upper graph of illustration 19 depicts the 4 mA to 20 mA staying within 10% to 100% of scale by switching ranges in output 1. The lower graph shows the 4 mA to 20 mA of output 2, reflecting the range in effect on output 1. enhances the resolution Illustration 19: Output with automatic range no Illustration 20: Output without range switching Page 34 www.iccontrols.com um-455-212
IC Controls 4 mA TO 20 mA OUTPUT SIGNALS To achieve results similar to those in illustration 19, use the settings in Table 5. Setting [in] Output 1 Output 2 [cond] [ArnG] [ON.OF] [LO] [on] 0 [on] 1 [HI] [unit] 500 [1E-3] 5 [ArnG] [YES] Table 5: Output settings Using the Alarm Contacts The alarm contact method uses the two alarm contacts to distinguish between ranges. contacts, there are four possible combinations. The on/off combinations for the A and B contacts are shown in Table 6. To use the alarm contacts for range indication set [CONF] [AL] [AL.A] [Func] to [rnG]. While the relay contacts are being used for remote range indication of output 1 range, the alarms will continue to function, ie. LED indication and alarm caution messages in the SAMPLE frame plus IC Net alarms. It is not possible to use the relay contacts for alarm indication and range indication at the same time. With two Using the Second 4 mA to 20 mA Output A more versatile method for indicating the range number for output 1 remotely is to use output 2. The following settings for output 2 will transmit the range number: [in] = [ArnG], [ON.OF]= [on] Range Number Output 1; % Full Scale Output 1; Conductivity (mS/cm) Output 2; mA Relay Contacts Range Number LO = 0 HI = 4 LO = 1 HI = 4 LO = 4 HI = 1 LO = 4 HI = 0 OUT2=OFF 4.00 4.00 4.00 4.00 1 100 500 4.00 A=0, B=0 1 8.00 4.00 20.00 20.00 2 10 50 8.00 A=0, B=1 2 12.00 9.33 14.67 16.00 3 1.0 5.0 12.00 A=1, B=0 3 16.00 14.67 9.33 12.00 4 0.1 0.5 16.00 A=1, B=1 4 20.00 20.00 4.00 8.00 Table 6: Example of range switching Table 7: Using output 2 for range indication Also, set the [HI] and [LO] parameters to indicate which values represent 4.00 mA and 20.00 mA. Table 7 shows the relationship between the range number and some of the possible LO/HI settings. um-455-212 www.iccontrols.com Page 35
4 mA TO 20 mA OUTPUT SIGNALS IC Controls Output Characterization The 455 analyzer has user-programmable output characterization that is off by default but can be turned on by the user. Output characterization could be used to provide more accurate control over an output device such as a non-linear ball-valve - the output could be customized to meet specific application needs. A 21-point output table allows the user to specify the behavior of the output in increments of 5% of the uncharacterized output signal. The table links uncharacterized output values to desired output values allowing a wide variety of non-linear behaviors to be described with high resolution. Each of the two outputs has its own independent characterization capability. Example: Bi-linear output Goal: Record the conductivity input between 0 µS/cm and 500 µS/cm, while giving 80% of the scale to the area between 0 µS/cm and 100 µS/cm. The purpose is to give maximum recorder resolution to the main area of interest, which is 0 µS/cm to 100 µS/cm, yet still maintain a record of the times that the conductivity would go over this limit. If output characterization were not available, the [LO] and [HI] could still be set to 0 µS/cm and 500 µS/cm respectively, but the area of interest from 0 µS/cm to 100 µS/cm would occupy only 20% at the bottom of the scale. To correct this, the center of the scale will be ‘expanded’ and the high area will be 'shrunk'. To achieve the desired output characterization, the 21-point characterization table and the high and low settings need to be defined. 1. Set the boundaries for conductivity output; [LO] = 0 µS/cm and [HI] = 500 µS/cm. characterization table will now automatically characterize the output so that 0% = 0 µS/cm and 100% = 500 µS/cm. 2. It is probably easiest to draw or sketch the characterization curve before entering any table values. A blank worksheet has been provided in Appendix B. This worksheet can be copied and can also serve as documentation for your analyzer setup. 3. The characterization curve for the example is shown in illustration 21. conductivity values corresponding to the uncharacterized output are shown at the top of the diagram. There are three points on the graph that are of most interest. a) 0% output corresponds to the [LO] setting of 0 µS/cm and 4.00 mA output. b) 'Normal' 100% output corresponds to the [HI] setting of 500 µS/cm and 20.00 mA output. c) At 100 µS/cm, 80% output is required. 4. Once the points of interest are identified, plot them on the graph and connect them with straight lines. 5. The column marked “% characterized output” can now be filled in by reading the coordinates off the graph. For example, to find the required table value for “10", locate 10 on the horizontal scale, follow the line up until it hits the curve. The table value is the value on the vertical axis, in this case 40. Refer to the arrows in illustration 21. 6. Once the columns in the table have been completed, enter the table values in the program. Select [tbL] from the output menu, then enter each output value. All 21 points must be entered - values cannot be skipped. Table 8 illustrates the completed table for the example. 7. To activate output characterization, set [CHAr] in the output menu to [on]. The For reference, the Page 36 www.iccontrols.com um-455-212
IC Controls 4 mA TO 20 mA OUTPUT SIGNALS % Uncharacterized Output Uncharacterized 4 mA to 20 mA Output % Characterized Output Corresponding Conductivity (µS/cm) Corresponding 4 mA to 20 mA Output (characterized) 0 4.00 0.0 0 (LO) (a) 4.00 5 4.80 20.0 25 7.20 10 5.60 40.0 50 10.40 15 6.40 60.0 75 13.60 20 7.20 80.0 100 (c) 16.80 25 8.00 81.3 125 17.00 30 8.80 82.5 150 17.20 35 9.60 83.8 175 17.40 40 10.40 85.0 200 17.60 45 11.20 86.3 225 17.80 50 12.00 87.5 250 18.00 55 12.80 88.8 275 18.20 60 13.60 90.0 300 18.40 65 14.40 91.3 325 18.60 70 15.20 92.5 350 18.80 75 16.00 93.8 375 19.00 80 16.80 95.0 400 19.20 85 17.60 96.3 425 19.40 90 18.40 97.5 450 19.60 95 19.20 98.8 475 19.80 100 20.00 100.0 500 (HI) (b) 20.00 Table 8: Characterization for Bi-Linear Example Illustration 21: Bi-linear output characterization um-455-212 www.iccontrols.com Page 37
ALARM FUNCTIONS IC Controls ALARM FUNCTIONS Two alarms, alarm A and alarm B, are a standard feature. Each alarm has an alarm contact associated with it which can be used for remote alarm indication or for control functions. two alarms function independently of each other. Either alarm can monitor the conductivity or the temperature input. Each alarm features an adjustable set-point, user- selectable alarm type, adjustable differential (also called hysteresis), unit selection, and an on/off switch. The alarm types which are available are high, low, deviation, and fault. Alarms can be set anywhere between 0 ?S/cm and 9 999 ?S/cm or 0 mS/cm and 9 999 mS/cm for the conductivity input or –10 °C and 210 °C for the temperature input. The differential is adjustable from 0 ?S/cm to 100 ?S/cm 100 mS/cm. The 0 mS/cm to or Illustration 22: Alarm menu Use of Relay Contacts By default, the relay contacts will be used to indicate alarm conditions. If there is an alarm condition then it will be indicated using both the LED and the relay contact. This function of the relay contacts can be selected by setting [CONF] [AL] [AL.A] [FUNC] and [CONF] [AL] [AL.b] [FUNC] to [AL]. If another use is selected for the relay contacts then the alarm cannot simultaneously use the contact, however, the alarm function continues using the LED, display messages and serial communication. The relay contacts can also be used for remote indication of range number for the first 4 mA to 20 mA output, PID pump pulse outputs, PID time proportional control, etc.. Alarm Indication The A and B LEDs on the front panel show the current state of each alarm and alarm contact. In addition, an alarm condition for an input will cause the sample display for that input to alternate with the alarm function, either [LO], [HI], [dEv], or [FLt]. This way the operator can quickly determine which alarm caused the alarm condition (alarm A or alarm B LED lighted), and the type of alarm. An LED that is "blinking" or "on" shows the alarm condition. The status of the relay contact can also be determined at a glance as it is activated when the LED is "on" and deactivated while the LED is only "blinking" or "off". The alarm LED will "blink" while the alarm override is in MANUAL because this situation deactivates the alarm contacts. Each alarm will simultaneously generate a caution number in the error menu. Messages for Alarms in section entitled Error Messages for a description of each alarm caution. The alarm cautions will not cause the error LED to come on because the error LED only comes on if there are any errors. To view alarm caution(s) using the error menu, select [Err] from the main menu, then use the Up or Down arrow key to scroll through the list of errors and cautions, if any. Illustration 23: Alarm status , alarm LEDs Refer to Caution Page 38 www.iccontrols.com um-455-212
IC Controls ALARM FUNCTIONS Alarm Override For normal alarm operation the alarms are said to operate in auto-mode. If the operator wishes to intervene and switch off the alarm contacts temporarily while attending to a problem, the alarms can be switched to manual override using the MANUAL key. In AUTO mode: The green AUTO LED is on and the analyzer alarms will activate and deactivate the relay contact as programmed. Press the MANUAL key to temporarily deactivate the alarm contacts. In MANUAL mode: The green AUTO LED will blink. The relay contacts are deactivated, but the alarm LEDs continue to indicate alarm condition(s). Press the AUTO key to return to AUTO mode immediately and reactivate the relays. If no key is pressed for 15 minutes, the 15-minute timeout will return the alarms to AUTO mode. Illustration 24: Alarm override status, AUTO LED Wiring and NO/NC Contacts The alarm contacts for alarms A and B may be wired as normally open or normally closed. By default, the analyzer assumes the alarm contacts are wired normally open. A normally open alarm contact will be inactive if there is no alarm condition and will be active when there is an alarm condition. If the program configuration and the wiring for each alarm do not match then the incorrectly configured alarm contact will generate an alarm when there is no alarm condition and vice versa. Refer to illustration 2 for the configuration menu. Select [CONF] [AL] from the menu. Delayed Activation Alarm relay activation, by default, is immediate upon alarm condition, or may be delayed. Delay gives the operator a chance to correct alarm situations before the relay contacts activate, or can eliminate alarms based on temporary or spurious change in the process. The delay time is programmable by the operator. To change or view the delay time, select [dLAY] from the alarm menu. The default value of 0 seconds is for immediate contact activation. The delay time can be set from 0 s to 9 999 s. Deviation Alarm A deviation alarm is practical when the process is expected to stay within a certain range. An alarm will be set if the input deviates too far from a set-point. Please note that the [dEv] frame only shows up in the menu after the alarm function has been changed to deviation alarm since it would have no effect for a high, low, or fault alarm. Example: If the conductivity is expected to stay between 100 ?S/cm and 200 ?S/cm, then we would set [in] to [cond], [Func] to [dEv], [SEt] to 150, and [dEv] to 50. Effectively, a high alarm at 200 ?S/cm and a low alarm at 100 ?S/cm has been set. The differential setting will continue to function as for high and low alarms. um-455-212 www.iccontrols.com Page 39
ALARM FUNCTIONS IC Controls High or Low Alarm A high alarm is set when the value of the conductivity or temperature rises above the set-point and is cleared when the conductivity or temperature drops to below the set-point minus the differential (refer to illustration 25). A low alarm is set when the value of the conductivity or temperature drops below the set-point and is cleared when the conductivity or temperature rises to above the set-point plus the differential (refer to illustration 26). The differential has the effect of setting the sensitivity of the alarm. The differential provides a digital equivalent of a hysteresis. A two-stage alarm can be implemented by choosing the same alarm function, ie. high or low alarm, for both alarms, but selecting different set-points. Example: The conductivity of a critical process may not drop to below 50 ?S/cm. Use alarm B as a low alarm set at 50 ?S/cm and use alarm A as an advance warning device by configuring it as a low alarm set at 100 ?S/cm. When alarm A is activated there is still time left to take corrective action. Illustration 25: High alarm Illustration 26: Low alarm Page 40 www.iccontrols.com um-455-212
IC Controls ALARM FUNCTIONS Fault Alarm A fault alarm for an input will be set when anything goes wrong with that input. Something is wrong with an input if the input is off-scale or an unacknowledged error message exists for that input. Caution messages do not cause a fault alarm. To use an alarm as a fault alarm, select [FUNC] from the alarm menu, then select [Flt]. To enable the alarm, make sure the on/off switch is set to [on]. Also, set the input in the alarm menu to the desired input, either conductivity or temperature. The set-point and differential for the alarm have no effect when the alarm is used as a fault alarm. Using Alarms for On/Off Control The alarms can also be used for process control - the alarm contacts will then function as on/off signals for switches controlling a valve, pump, motor, etc.. The set-point determines the control point of the system and the setting of the differential controls the amount of corrective action before a controlled shut-off occurs. Examples of high and low control using the alarms are shown in the following illustrations. Illustration 27: Low control Illustration 28: High control um-455-212 www.iccontrols.com Page 41
CONFIGURATION OF PROGRAM IC Controls CONFIGURATION OF PROGRAM The 455 analyzer has been designed with ease-of-use in mind. In most cases the analyzer factory configuration will handle the application and no configuration of the analyzer is necessary. Relay Contacts; NO/NC The 455 program by default assumes the relay contacts are wired normally open. A normally open relay contact will open if there is no alarm and will be closed by the microprocessor when there is an alarm condition. If the program configuration and the wiring do not match the incorrectly configured relay, it will generate an alarm when there is no alarm and vice versa. Auto-Ranging Conductivity The analyzer program allows the user to select either manual or automatic ranging. By default, the analyzer will automatically switch between ranges. Refer to the section entitled Automatic Range Switching for further details. Re-initializing All Settings Occasionally it may be desirable to reinitialize all of the program settings to bring them back to default. Executing an initialization will cause the analyzer to reset all the program variables and settings to factory defaults. Parameters such as the output signal settings, alarm settings, and the program configuration will need to be re-entered if they were different from the factory default settings. Select [CONF] [init] [ALL] from the menu. The display will flash [do]. Nothing will happen if you press CANCEL or SAMPLE. The analyzer will re-initialize only when the user presses ENTER. Password Security The factory default is no security. No password security should be necessary if you are the only user and no protection of settings is needed. Password security should be implemented for critical applications where program settings may only be changed by authorized personnel. For minimal security, IC Controls advises that the user set a level 2 password. Leaving the level 1 password at “000" gives the operator complete access to all areas of the program but does not allow settings to be changed in the configuration menu. With minimal security in place, unauthorized users are prevented from enabling password security. Appendix A describes how to enable or disable security. Temperature Input Calibration Refer to the Electronic Hardware Alignment, Alignment of Temperature Input Circuit section for the procedure on calibrating the temperature input. Illustration 29: Configuration menu Page 42 www.iccontrols.com um-455-212
IC Controls TROUBLESHOOTING TROUBLESHOOTING When trying to determine what the problem is with a conductivity loop, there are a few simple steps to follow: Isolating the Problem FIRST: Write down the symptoms. a) conductivity reading b) temperature reading c) conductivity cell constant in analyzer d) sensor cell constant on the label SECOND: Separate the sensor from the analyzer so that the problem can be isolated. Disconnect the sensor from the analyzer at the terminal block - it is much easier to test and determine if the problem is in the conductivity sensor or in the analyzer this way. THIRD: See if the analyzer reads correctly without the sensor. a) With sensor leads removed, the analyzer should read 0 µS/cm or mS/cm, depending on units selected, or close to zero. b) Insert a 1 000 ohm, 1% resistor across the sensor cell connection and a second one across the sensor TC connections. NOTE: If the temperature reading is approximately 0 °C (or 32 °F), then the analyzer looks alright. c) Change the analyzer cell constant setting to 1.00 and TC to manual, set at 25 °C. NOTE: If the conductivity reading is approximately 1 000 µS/cm (or 1.00 mS/cm), then the analyzer looks alright. d) If the reading is far from 1 000 µS/cm, perform a calibration with [Cal] set to 1 000 µS/cm and note the calculated conductivity cell constant in [CELL]. e) When finished, set TC back to auto and remove both resisters. FOURTH: Problem isolated If the [CELL] is within 10% of 1.00, then the analyzer appears OK. If the analyzer is OK, then the problem is likely with the sensor. If the [CELL] is greater than 10% out, the problem may be in the analyzer. Troubleshooting Hints Slow Response Typically due to excessive sample line length and low flow, producing long sample transport lags. Resolve by adding a fast-flow loop with the sensor in a short side stream, or by shortening the line. Slow response can also be caused by a buildup of dirt in the sample line. In this case, the problem may be alleviated by changing the take-off point or by installing a knock-out pot. Alternatively, a dirty- water sample system may be needed. Readings consistently low or spike low Characteristic of bubbles in the sample line passing through the sensor or hanging up in the sensor. Review the installation instructions provided with the conductivity sensor. um-455-212 www.iccontrols.com Page 43
TROUBLESHOOTING IC Controls Readings gradually falling The analyzer can no longer be calibrated properly. This problem is typical of scale or sludge/slime deposits in the sensor - the sensor will need to be cleaned. Refer to the Yearly Maintenance procedure in this manual or in the sensor manual. Readings at maximum “+Err” message under all conditions. First verify that the analyzer is displaying conductivity using mS/cm units. The analyzer will display “+Err” if conductivity is above 9 999 ?S/cm with ?S/cm units selected for the display. This condition is indicated by CA1.9. If unit selection is not the problem, then either the sensor is shorted or there is a problem with the wiring/analyzer setup. This condition is indicated by E1.6. Test for shorts by disconnecting sensor from analyzer and checking impedance between black and white leads with sensor in air. Insulation value should exceed 1 M?(megaohm) if sensor OK. If the sensor is OK, then substitute resistors for the sensor to test the wiring and the analyzer. If the problem persists with the resistors in place then it is an analyzer problem. Use the following formula or consult the table below for resistance values to use. cellconstant?106 S?cmof solutionat25°C If the sensor tests OK, i.e. no shorts as per above test procedures, and the analyzer and wiring work OK with substitute resistors as in table 9, but the “+Err” message and E1.6 still occur when the analyzer and sensor are hooked up and placed in service, then the conductivity is too high for the cell constant used. Resolve by determining the actual conductivity and selecting a new conductivity sensor with the correct cell constant. Elevated readings on low conductivity The analyzer reads high at the low end of the range. In some cases, the analyzer will give a low reading even with the conductivity sensor in air. Large zero signals are indicative of a wiring problem. Look first at shielding between leads and ensure the shield is connected to the analyzer shield terminal rather than electrical ground. Other known causes include incorrect cable or cable lengths too long for the application. Where the elevated zero is small, it is likely due to cable resistance/capacitance and can be zeroed out using the air zero calibration procedure. ? resistance Conductance (?S) Resistance (?); 1.0/cm cell constant 1 000 000 100 000 Resistance (?); 0.1/cm cell constant 100 000 10 000 1 10 100 1 000 10 000 1 000 1 000 100 10 000 100 000 1 000 000 100 10 1 10 1 0.1 Table 9: Resistance values for simulation Page 44 www.iccontrols.com um-455-212
IC Controls ELECTRONIC HARDWARE ALIGNMENT ELECTRONIC HARDWARE ALIGNMENT Alignment of Conductivity Detection Circuit 1. Install a 700 ? resistor between electrode drive and sense; TB200 terminals 1 and 3. 2. Set the conductivity input to manual range and switching on range 3. From the menu, select [CONF] [in] [cond] [AUTO] and change the setting to [no] (no auto ranging). Then select [CONF] [in] [cond] [rANG] from the menu and set the range to [rNG.3]. 3. Set up a precision volt meter, Fluke 8050A or equivalent, to read 4.000 VDC. Use sensor shield connection, TB200 terminal 2 as common, and left side of R212. Refer to drawing D5920093 (Rev.1.9). Adjust electronic standardize with blue trim-pot VR200 at left edge of board for a reading of 4.000 VDC which is approximately 600 mV peak-to-peak square wave. 4. Set the analyzer to manual temperature compensation and set the manual TC temperature to 25 °C. Set manual temperature compensation by selecting [cond] from the menu. If the analyzer displays [Auto], press ENTER to go into edit mode, and press Down arrow key to display [SEt], then press ENTER. Press Right arrow key to display the manual TC temperature. Change this temperature to 25 °C. 5. With multimeter common on TB200, terminal 2 (sheild); adjust to 4.85 VDC ? 0.005 VDC, TP202 (or pin 1 of U203), using VR201 blue span adjust potentiometer just to left of pin1. 6. Return conductivity input to automatic range switching by selecting [CONF] [in] [cond] [Auto] from the menu and changing the [no] setting to [YES]. Alignment of Temperature Input Circuit The temperature input can be adjusted both by making electronic adjustments and/or by having the program compensate for differences in offset. Both procedures are described below. The temperature input of the 455 microprocessor analyzer requires a 1 000 ? TC in the sensor. Adjusting Electronic Calibration 1. Remove the offset calculated by a previous software calibration of the temperature input. Select [CONF] [in] [°C] [OFFS] from the menu and edit the offset to read 0.0. 2. Set up a precision multimeter, Fluke 8051A or equivalent, to read VDC. 3. Use TB200, terminal 2, as common. Refer to drawing D5920093 (Rev1.9). Place a 1 000 ? 1% resistor across T+ and T- terminals. Adjust blue trim-pot VR202, located at the top-right side of TB201, for a reading of 0.200 V at TP203. 4. Place a 1.74 k? 1% resistor across T+ and T- terminals. Adjust blue trim-pot VR203, located at the top-right side of U203, for a reading of 4.80 V at TP203. 5. Close the case and press SAMPLE followed by the Down arrow key to display the temperature reading. 6. Re-insert the 1 000 ? 1% resistor and adjust VR202 until the display reads 0.0 °C ± 0.1 °C. 7. Re-insert the 1.74 k? 1% resistor and adjust VR203 until the display reads 195.0 °C ± 0.2 °C. um-455-212 www.iccontrols.com Page 45
ELECTRONIC HARDWARE ALIGNMENT IC Controls Software Calibration To do a software calibration of the temperature input, the correct temperature needs to be known. 1. Select [CONF] [in] [°C] [CAL] from the menu. temperature sensor will be displayed. Edit the displayed value to the known correct temperature. Press ENTER to leave edit mode, then SELECT to start the calibration. 2. The current temperature will be shown using a flashing display. When the input appears to be stable, press ENTER to set the new temperature. The software offset for the temperature input will be adjusted automatically. 3. The calculated offset in degrees Celsius can be viewed by selecting [CONF] [in] [°C] [OFFS] from the menu. Whenever the hardware alignment is ‘correct’, the offset will be 0.0. The displayed offset can be edited. Calibration of 4 mA to 20 mA Outputs Use one of the following two approaches to get the analyzer to output the desired current level, and then make electronic adjustments to calibrate the output. Approach 1: Simulated 4 mA to 20 mA Output (Self Calibration) 1. Select [cur] from the output 1 menu to display the present output current in mA. The display will be updated as the output current changes based on the input signal and the program settings. 2. To simulate a different 4 mA to 20 mA output signal, press ENTER to select edit mode. Use the arrow keys to display the desired output needed for testing the output signal. Press ENTER to select the displayed value. The output signal will be adjusted to put out the desired current. This process can be repeated as often as necessary to output different signal levels. 3. The output signal is held at the displayed level until the program leaves this menu selection. Make calibration adjustments while the analyzer shows the output at 20.00 mA. 4. Repeat the above steps for output 2. Approach 2: Use Voltage Source to Adjust Input This faster calibration approach requires a voltage source for the input. 1. To calibrate output 1, set [in] = [°C]. Input a low enough signal to cause analyzer to indicate [- Err]; the analyzer will output 4.00 mA. Reverse the polarity or input a high enough signal to cause the analyzer to indicate [+ Err]; analyzer will output 20.00 mA. 2. Repeat step 1 for output 2. Tip: Both outputs can be simultaneously calibrated if you set [in] = [°C] for both inputs. The actual temperature as measured by the Page 46 www.iccontrols.com um-455-212
IC Controls ELECTRONIC HARDWARE ALIGNMENT Adjusting Electronic Calibration 1. The outputs are isolated from the main circuit, therefore, measurements are made with common at the output 2 terminal, TB304. 2. Measure output 1 ‘zero’ at TP301 (pin 8 of U304) while output 1 is outputting 4.00 mA. The reading should be between -0.870 VDC and -1.250 VDC. Adjust #2 voltage with VR300. 3. Change analyzer output to 20.00 mA; switch multimeter to mA and measure + terminal of output 1, at TB303, and adjust VR301 so that the current reads 20.00 mA. Return analyzer output to 4.00 mA and trim actual output to 4.00 mA using VR300. Check again at 20.00 mA and repeat adjustments until satisfied. 4. Measure output 2 'zero' at TP300 (pin 7 of U304) while output 2 is outputting 4.00 mA. The test point should read between -0.870 VDC and -1.250 VDC. Adjust #2 ‘zero’ voltage with VR302. 5. Change output at output 2 to 20.00 mA; switch multimeter to mA and measure + terminal of output 2, at TB304, and adjust VR303 (span pot) until the current reads 20.00 mA. NOTE: Zero and span are very wide range adjustments which show small interactions. Recheck zero and span to confirm good calibration. 6. If so desired, all software settings can be returned to factory default condition by following the procedure in Configuration of Program; Re-initializing All Settings. Testing Relay Outputs 1. Relay output operation can be verified by testing for contact closure or continuity at each relay. To activate a relay, select [CONF] [NO.NC] [AL.A] from the menu. Press ENTER to go into edit mode, then press the Up or Down arrow key to change the normally open/normally closed configuration from open to closed. Press ENTER to accept the new value. A closed contact should open and an open contact should close. 2. Repeat step 1 for for the Alarm B contact. 3. If so desired, all software settings can be returned to factory default condition by following the procedure in Configuration of Program; Re-initializing All Settings. um-455-212 www.iccontrols.com Page 47
DISPLAY PROMPTS IC Controls DISPLAY PROMPTS [1] [100] [1E-3] [1E-6] [ACC.n] [AL] [AL.A] [AL.b] [AUto] [ASCI] [BAud] [°C] [CAL] [CELL] [CHAr] [CHIP] [CLr] [cnt] [CLSd] [cond] [CONF] [Cont] [cur] [dA] [dAtE] [dEc] [dEv] [dLAY] [do] [donE] [Err] [Er.94] [°F] [FLt] [FrEq] [FULL] [HI] [Hold] [hour] [hund] [iLOG] [in] [LO] [NodE] [NO.NC] [OFF] [OFFS] Actual cell constant (multiplication factor 1) Cell constant x100 Conductivity units in millisiemens per centimeter; (from E-3 = milli) Conductivity units in microsiemens per centimeter;(from E-6 = micro) Access level for security. Displayed after password entered by user Alarms AlarmA Alarm B Automatic ranging of conductivity input; yes/no switch ASCII serial output log Baud rate for serial communications Temperature in degrees Celsius; use metric units Calibrate analyzer Cell constant Output characterization on/off Chip: Is this analyzer equipped with a real-time clock chip? Clear the internal data log Count of number of readings in internal data log Normally closed alarm contact Conductivity input Configuration of program menu Continue internal data log when buffer full Signal output in mA, or current Input damping, in seconds Date: Real-time clock setting for day of the month (1-31) Decimal places Deviation alarm Alarm activation delay Do: press ENTER to execute the reset/clear action Done: Reset/clear action has been taken Error or warning number RAM checksum failed. Some settings may be lost Temperature in degrees Fahrenheit; use imperial units Fault alarm Frequency of internal data log updates in seconds Full: What to do when internal data log is full; continue or stop High alarm; high limit (20 mA) for 4 mA to 20 mA output window Output hold during calibration Hour: Real-time clock setting Hundredth of a second: Real-time clock display Internal data log Input OR Minute: Real-time clock setting Low alarm; low limit (4 mA) for 4 mA to 20 mA output window Node number for IC Net communications Normally open/Normally closed Off Offset Page 48 www.iccontrols.com um-455-212
IC Controls DISPLAY PROMPTS [ON] [ON.OF] [onth] [OPEN] [out] [out 1] [out 2] [PAS.1] [PAS.2] [PASS] [rANG] [rnG] [rtc] [SEC] [SEr] [SEt] [StAr] [StOP] [tbL] [unit] [YEAr] On On/off switch Month: Real-time clock setting Normally open alarm contact Output menu First 4 mA to 20 mA analog output channel Second 4 mA to 20 mA analog output channel Set password 1, operator access Set password 2, complete access Enter password to change access level Analyzer conductivity input range selection Range number Real-time clock Seconds: Real-time clock setting Serial communications menu Setpoint: Select manual temperature compensation Start internal data log Stop internal data log Characterization table Display/setting of units Year: Real-time clock setting um-455-212 www.iccontrols.com Page 49
GLOSSARY IC Controls GLOSSARY Cell constant describes enclosed volume between electrodes in the conductivity sensor. Units are cm-1. Higher cell constants produce higher analyzer ranges; lower cell constants produce lower ranges. Conductivity the amount of electrical current that flows through a liquid. Generally reported as microsiemens per centimeter (µS/cm) or millisiemens per centimeter (mS/cm). EPROM Erasable Programmable Read Only Memory. The EPROM chip holds the program which determines the functioning of the 455 analyzer. Replacing the EPROM chip with a chip containing a new or an updated program changes the way the analyzer functions. The EPROM chip is programmed by the manufacturer. Hysteresis the reading at which an alarm is turned on is not the same reading at which the alarm is turned off again. This phenomenon is referred to as the hysteresis. LED Light Emitting Diode. LEDs are used as on/off indicators on the front panel of the 455. LTCC (Linear Temperature Compensation Constant) reading by 2.0 % per degree Celsius so that the effective conductivity at 25 °C can be displayed. mho the reciprocal of ohm; ohm spelled backwards. The equivalent of mho is siemens, which is the modern naming for this unit. microsiemens (µS/cm) unit of conductivity. Micro is the metric prefix meaning one millionth. 1 106ohm?cm?106siemens?cm millisiemens per centimeter (mS/cm) unit of conductivity. microsiemens per centimeter. Milli is the metric prefix meaning one thousandth. Menu he series of prompts which determine the layout of the program used by the analyzer. Microprocessor an integrated circuit (chip) which executes the program on the EPROM chip and controls all the input/output functions. NC Normally closed NO Normally open Normally closed each of the alarm contacts can be wired and configured as normally open or normally closed. A circuit which is wired normally closed will be closed (i.e. the external device wired to it is turned on) when the analyzer is not powered. Normally open a circuit which is wired normally open will be open (i.e. the external device wired to it is turned off) when the analyzer is not powered. On/Off control control response in which the contact is either fully on or fully off. RAM (Random Access Memory) Memory in a RAM chip can be both written to and read from. contents of RAM will disappear as soon as the RAM chip loses power. The RAM chip has a battery backup device which preserves the contents of the RAM chip for a considerable time even if the analyzer is turned off. All settings are stored in RAM. siemens per centimeter (S/cm) unit of conductivity S?cm?1ohm cm TC Temperature compensator Temperature compensation correction for the influence of temperature on the sensing electrode. The analyzer reads out concentration as if the process were at 25 °C or 77 °F, regardless of actual solution temperature. The default LTCC of 2.0 adjusts the conductivity S?cm? 1 millisiemens per centimeter = 1 000 The Page 50 www.iccontrols.com um-455-212