Download
1 / 27
270 likes | 367 Views
Designing Graphics. Strategic Planning for Visual Information in your Formal Report. Preplanning Your Graphics. Choose the type of graphic and know why that type was chosen Know how it will benefit your document (be as specific as possible) Know how it will be helpful to readers

E N D
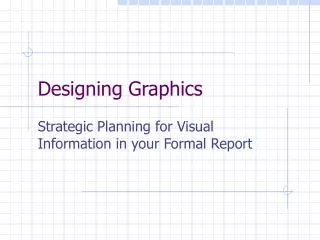
Designing Graphics Strategic Planning for Visual Information in your Formal Report
Preplanning Your Graphics • Choose the type of graphic and know why that type was chosen • Know how it will benefit your document (be as specific as possible) • Know how it will be helpful to readers • Describe the data it will present • Know how you plan to prepare it or otherwise obtain it
Common Misuses of Graphics • Distorting charts by varying the grid scale or skipping intervals • Misusing statistics by using inappropriate ones or too small a data base • Omitting relevant data • Using them to pad a skimpy report
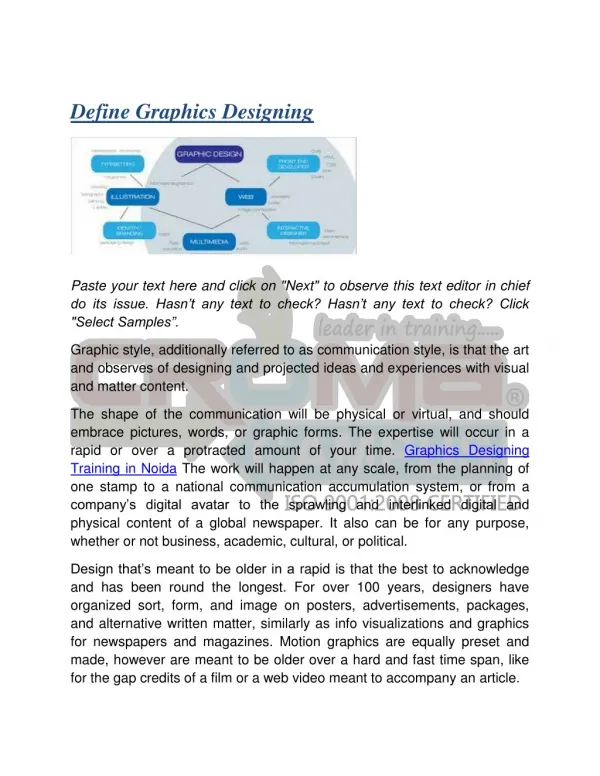
Major Types of Graphics • Tables • Line Graphs • Bar Graphs • Pie Charts • Diagrams • Photos or Drawings
display numbers or words arranged in a grid. They are good for situations where exact numbers need to be presented. Some examples are Describing the components of a program's implementation. Displaying attrition. Displaying pre- and post-test results. Presenting correlations or comparisons. Tables
Line graphs show sets of data points plotted over a time period and connected by straight lines. Line graphs are useful for displaying Any set of figures that needs to be shown over time. Results from two or more groups compared over time. Data trends over time. Line Graphs
Bar graphs show quantities represented by horizontal or vertical bars and are useful for displaying The activity of one thing through time. Several categories of results at once. Data sets with few observations. Bar Graphs
Pie charts show proportions in relation to a whole, with each wedge representing a percentage of the total. Pie charts are useful for displaying The component parts of a whole in percentages. Budget, geographic or population analysis. Pie Charts
Diagrams show complex processes and projects; relative positions, roles and responsibilities within organizations; historical perspectives; future plans; and parts and details that are usually hidden. In general, diagrams are used for Ideas, facts, priorities and processes. Where things are located or how they work. Relationships when quantitative information is not the primary focus. Diagrams
Sample Diagram Diagram Example(Not actual data)
Photographs or drawings can enhance a report by making concrete the images and facts conveyed in your words. Photos emphasize accuracy; drawings suggest possibilities. They can Document exact conditions Highlight relevant information while excluding the irrelevant Photographs or Drawings
Checklist for Effective Graphics-1 • Have you noted in your document outline the approximate location of your graphics? • Does the text preceding a table or figure make clear why the visual is there and what it shows? • Is the language in the text describing the graphic consistent with the language in the graphic? • Do all graphics have clear, concise captions?
Checklist (cont.) • Is the graphic located as close as possible to the text describing it? • Does the text following the graphic analyze and use its contents to further your argument? • Have you allowed adequate white space around and within the graphics in your documents? • Do the layout and design of your finished document highlight the organization and hierarchy of your information?
Remember • Graphics are part of your persuasive strategy. They should be used for a specific argumentative reason. • A bad graphic is worse than no graphic at all. • Not everybody loves USA Today.
Sources • http://www.ces.ncsu.edu/depts/fcs/beyonddata/index.htm • www.bobvila.com • www.diynet.com • Markel, Writing in the Workplace (1997)