Download
1 / 44
440 likes | 553 Views
ICHEP `06, Moscow The Auger project – status and results G. Matthiae University and Sezione INFN of Roma “Tor Vergata”. Study of the highest energy cosmic rays

E N D
ICHEP `06, MoscowThe Auger project – status and resultsG. MatthiaeUniversity and Sezione INFN of Roma “Tor Vergata” Study of the highest energy cosmic rays • 17 Countries: Argentina, Bolivia, Australia, Brazil, Rep.Ceca, France, Germany, Italy, Mexico, Netherlands, Poland, Portugal, Slovenia, Spain, UK, USA, Vietnam. • About 300 physicists
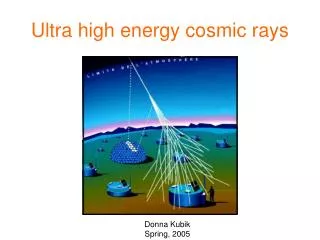
Above Ethr ≈ 7*1019 eV, protons loose rapidly energy via pion photoproduction. Interaction length ≈ 6 Mpc Energy loss ≈ 20 % / interaction p + γ 2.7 K → N+ π Greisen-Zatsepin-Kuzmin
AGASA sees a continuation of the spectrum beyond the GZK suppression • Dashed curve represents the spectrum expected for extragalactic sources distributed unifomly in the Universe. • Extremely poor statistics - only 11 events above 1020 eV
Fluorescence Detector (FD) • Longitudinal development of the shower • Calorimetric measurement of the energy • Calibration of the energy scale • Direction of the shower • 12% duty cycle ! Auger hybrid detector • Surface Detector (SD) • Front of shower at ground • Direction of the shower • “High” statistics
Very flat region “Pampa Amarilla” Malargüe (Argentina) Southern Observatory (Argentina) 35o S latitude 69o W longitude ≈ 1400 m height ≈ 875 g/cm2 • Very low population density (< 0.1 / km2) • Very good atmospheric conditions (clouds, aerosol…) Future plan for Northern Observatory in Colorado (USA)
The Auger Observatory • Total area ~3000 km2 • Surface detectors (“water tanks”) • 1.5 km spacing • 24 fluorescence telescopes • 6 in each of 4 buildings About ¾ installed and operational Completion in 2007 50 km
Communicationantenna GPSantenna Electronics enclosure 40 MHz FADC, local triggers, 10 Watts Solar Panel three 9” PMTs Plastic tank with 12 tons of water Battery box Water Tank in the Pampa
m-response ~ track • e/g-response ~ energy Inclined: m/em UP m-signal of order em-signal
VEM SD calibration & monitoring Base-Temperature vs Time Single tank response single muons ~100 p.e. Noise Signal-Height vs Time Signal-Height vs Base-Temp ± 3% Huge Statistics! Systematic error ~5%
Doublets 11m Time resolution Dia Noche Low energy events (~ 1015 eV) used to compare the time measurement of each tank : physical dispersion due~13 ns) Time precision of individual tanks ~ 12 ns
density falls by factor ~150 … by factor ~4 Young & Old Shower ‘young’ shower ‘old’ shower
One event of high energy:~1020 eV, q ~60° 34 tanks ~60° ~ 8 km (m) ~ 14 km propagation time of 40 µs LDF S=A [r/rs (1+r/rs)] -β rs = 700 m A, β from fit (β= 2-2.5) S(1000) energy estimator Lateral Distribution Function ~1020eV ~11020eV
Angular resolution from the surface detector depends on the number of tanks Improved for hybrid events: ~ 0.6 degrees
The FD telescope(Schmidt optics)Field of view 30x30 degrees Diaphragm Spherical mirror PMT camera Shutter UV Filter
Spherical aberration Coma aberration The Schmidt optics C C C F spot Diaphragm Coma suppressed C Spherical focal surface
Fluorescence Telescope Spherical mirror (R=3.4 m) Diaphragm and camera
Diaphragm, corrector ring and camera Field of view: 300x300 Camera: 440 photomultipliers Aperture of the pixels: 1.50
Atmospheric Fluorescence Photon yield as a function of height Error about 15% Nitrogen emission spectrum 300 – 400 nm
light flux measured by absolutely calibrated PMT light diffusing Tyvek walls Drum: uniform camera illumination pulsed light sources, several wavelengths and intensity FD Absolute Calibration About 5 photons/ADC count
355 nm Steerable laser SD tank optical fiber FD “TEST BEAM” Central Laser Facility
Atmospheric absorption LIDAR Backscattering Elastic bcks. molecular/Rayleigh & aerosol/Mie (Raman) DAQ Laser Mirror
LIDAR Station Steerable system: “Shoot on shower” technique
bin=100 ns Event FD on-line
Longitudinal profile of showers from the FD telescopesFit with empirical formula of Gaisser-HillasCalorimetric measurement of the energy.
Correction for energy loss (neutrinos, muons) 8 – 12 % at 1019 eV
New upper limit on photon fraction E0>10 EeV events • Xmax from showers longitudinal profile observed by the fluorescence detector • ΔXmax ≈ 25 g cm-2 • 29 events
Distribution of the differences Δγin standard deviations between primary photon prediction and data Δγ = 2 – 3.8
New Photon Limit (29 events) 16% upper limit HP: Haverah Park A1,A2: AGASA Constraint on top-down/non acceleration models End 2009: about 2% limit at 10 EeV, 15% at 35 EeV
Study of excess from the Galactic Center Comparison to AGASA Energy interval (1.0 – 2.5 EeV), angular scale 20° 2116 / 2159.5 ratio = 0.98 ± 0.02 ±0.01 (22% excess would give 2634 and a 10- excess) Comparison to SUGAR Energy interval (0.8 – 3.2 EeV), angular scale 5° 286 / 289.7 ratio = 0.98 ± 0.06 ± 0.01 (85% excess would give 536 and a 14.5- excess)
Energy calibration – hybrid eventsEnergy obtained by the calorimetric measurement of the fluorescence detector sets the absolute energy scaleSimulation not needed. FD energy log10 E (EeV) Absolute calibration of the energy estimator S(1000) log10 S(1000) Corrected to 38 degrees
Statistics is now about ½ year of full Observatory (~7000 km2 sr yr) Efficiency =100% above 3 EeV Systematic error on the energy ±~ 25%