Analyzing Starlight
270 likes | 401 Views
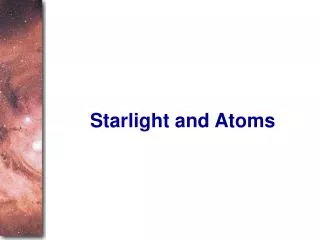
Analyzing Starlight. Image of stars in the direction of the center of the Milky Way Galaxy, taken by the Hubble Space Telescope How do the stars appear different?. Not All Stars are Alike. Stars appear different in brightness , from very bright to very faint

Analyzing Starlight
E N D
Presentation Transcript
Analyzing Starlight AST 2010: Chapter 16
Image of stars in the direction of the center of the Milky Way Galaxy, taken by the Hubble Space Telescope How do the stars appear different? AST 2010: Chapter 16
Not All Stars are Alike • Stars appear different in • brightness, from very bright to very faint • color, from red to blue-white • size • A good constellation for seeing star colors in the winter sky is Orion(the hunter) • Betelgeuse, a red super- giant star • Rigel, a blue super-giant star AST 2010: Chapter 16
Betelgeuse AST 2010: Chapter 16
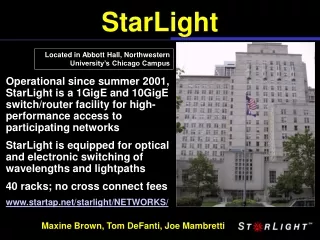
Brightness of Stars (1) • The total amount of energy at all wavelengths that a star emits is called its luminosity • Note: this is how much energy the star gives off each second, NOT how much energy ultimately reaches our eyes or telescope • The luminosity of a star is perhaps its most important characteristic • The amount of a star’s energy that actually reaches a given area each second here on Earth is called the star’s apparent brightness • If all stars had the same luminosity, their apparent brightnesses would tell us how far they are from us • The inverse-square law of light propagation: the apparent brightness of a light source decreases as the square of the distance from it AST 2010: Chapter 16
Brightness of Stars (2) • The inverse-square law implies that • a star will appear 4 times fainter if an observer’s distance from it is doubled, 9 times fainter if the distance is tripled, etc. • In reality, stars generally do not have the same luminosity • In other words, they are not “standard bulbs” • Consequently, distance is the among the most difficult quantities to measure in astronomy AST 2010: Chapter 16
Stars’ Apparent Magnitudes (1) • A star’s apparent brightness is described using the magnitude system • The system was devised by the Greek astronomer Hipparchus around 150 B.C. • He put the brightest stars into the first-magnitude class, the next brightest stars into second-magnitude class, and so on, until he had all of the visible stars grouped into six magnitude classes • Examples: a star of the 1st magnitude appears 2.5 times brighter than a star of the 2ndmagnitude, whereas a star of the 2nd magnitude appears 40 times brighter than a star of the 6th magnitude AST 2010: Chapter 16
Stars’ Apparent Magnitudes (2) • Thus, the smaller the magnitude, the brighter the object being observed! • The old magnitude-system was based on how bright a star appeared to the unaided eye • Today’s magnitude system (based on more accurate measurements) goes beyond Hipparchus' original range of magnitudes 1 through 6 • Very bright objects can have a magnitude of 0, or even a negative number • Very faint objects have magnitudes greater than +10 AST 2010: Chapter 16
Stars’ Colors and Temperatures • A star is a ball of dense, hot gas that emits a continuous spectrum of radiation • The spectrum is very similar to that of radiation emitted by a blackbody • The most intense color of a star is related to its surface temperature by Wien’s law • The higher the temperature, the shorter the wavelength of the most intense color • Thus • Blue colors dominate the light output of very hot stars • Cool stars emit most of their visible radiation at red wavelengths • Our Sun’s surface temperature is about 6,000 K, with the dominant color being a slightly greenish yellow • Hottest stars can have surface temperatures of 100,000 K, whereas coolest stars have surface temperatures of about 2,000 K AST 2010: Chapter 16
Star’s Color Temperature AST 2010: Chapter 16
Determining Star’s Temperature • To determine the exact color of a star, astronomers usually observe its brightness through filters • A filter allows only a narrow range of wavelengths (colors) to pass through • Two commonly used filters are • a blue (B) filter that lets through only a narrow band of blue wavelengths • a “visual” (V) filter that lets through only colors around the green-yellow band • The colored light transmitted by each filter has its own brightness, usually expressed in magnitudes • The relative brightness of the transmitted colors can tell if the star is hot, warm, or cool AST 2010: Chapter 16
B-V Color Index • A B-V color index is defined as the difference in magnitude between the B and V bands • A hot star has an index of around 0 or a negative number, while a cool star has an index close to 2.0 • Other stars are somewhere in between AST 2010: Chapter 16
Spectra of Stars • To analyze starlight, one can also use spectroscopy, instead of filters • In general, the spectra of different stars look different • The primary reason is that stars have different temperatures • Most stars are very similar in composition to the Sun • Hydrogen is the most abundant element in stars • In the hottest stars, the hydrogen atoms are completely ionized (no longer have their electrons attached) due to the high temperature and, consequently, they cannot produce hydrogen absorption lines in the spectra • In the coolest stars, the hydrogen atoms are all in lowest state and, consequently, hydrogen transitions that can occur do not produce absorption lines in the visible spectrum • Only stars with intermediate surface temperatures (not too hot, not too cool — about 10,000 K) have spectra with hydrogen lines AST 2010: Chapter 16
How Absorption Line is Produced AST 2010: Chapter 16
Spectral Classes • Astronomers sort stars according to the patterns of lines seen in their spectra into seven principal spectral classes • From hottest to coldest, the classes are designated O, B, A, F, G, K, and M G K M O B A F AST 2010: Chapter 16
Spectral Classes L and T • Since 1995, astronomers have discovered objects cooler than those in class M, but they are not considered true stars because they are not massive enough • Objects with masses less than 7.2% of or our Sun’s mass (0.072 MSun) are not expected to become hot enough for the nuclear fusion to take place • Those objects are called brown dwarfs • They are very faint and cool, emitting radiation in the infrared part of the spectrum • The warmer brown dwarfs are assign to spectral class L, and the cooler ones to spectral class T AST 2010: Chapter 16
Spectra of Stars in Different Spectral Classes AST 2010: Chapter 16
(a) (b) v Observer B Observer A Source Observer B Observer A Source Doppler Effect in Sound Waves • Case (a) • The source is moving towards observer A • Observer A sees a compressed wave, and hence a shorter wavelength (or a higher frequency) • Observer B sees a stretched wave, and hence a longer wavelength (or a lower frequency) • Case (b) • The source is stationary • Observers A and B both see same wavelength AST 2010: Chapter 16
Doppler Effect in Starlight • The motion of a star causes its spectral lines to shift positions • The shift depends on its speed and direction of motion • If the star is moving toward us, the wavelengths of its light get shorter • Its spectral lines are shifted toward the shorter-wavelength (bluer) end of the spectrum • This is, therefore, called a blueshift • If the star is moving away from us, the wavelengths of its light get longer • Its spectral lines are shifted toward the longer-wavelength (redder) end of the visible spectrum • This is, thus, called a redshift AST 2010: Chapter 16
Doppler Effect in Stellar Spectra • The Doppler effect doesn’t affect the overall color of an object, unless it is moving at a significant fraction of the speed of light (VERY fast!) • For an object moving toward us, the red colors will be shifted to the orange and the near-infrared will be shifted to the red, etc. • All of the colors shift • The overall color of the object depends on the combined intensities of all of the wavelengths (colors) AST 2010: Chapter 16
The Sun’s Spectral Shifts • The Sun’s spectra at 3 speeds (0, 0.01c, 0.1c) • The hydrogen-alpha line (at 656.3nm) is shown • The Doppler-shifted continuous spectrum of the Sun moving at 0.01c is almost indistinguishable from that of the Sun being at rest AST 2010: Chapter 16
Doppler Shift of Spectral Lines • The Doppler shift of spectral lines is measurable even for slow speed • Astronomers can detect spectral-line Doppler shifts for speeds as small as 1 km/sec or lower (less than 3.310-6 c) AST 2010: Chapter 16
Doppler Effect in Stellar Rotation The broadening of spectral lines indicates that the star is rotating The greater the broadening, the greater the speed of rotation AST 2010: Chapter 16