Demographiebericht
180 likes | 280 Views
Demographiebericht. Informationsveranstaltung im Pfarrheim Kreuzberg 18. April 2008. Land NW: +8% RBK: +10%. +17%. 1988 - 2000. 1975 - 1987. 2001 - 2006. - 5.667. + 1.573. - 2.039. 1988 - 2000. 2001 - 2006. 1975 - 1987. 1975 - 1987. 2001 - 2006. 1988 - 2000. + 11.236. + 40.233.

Demographiebericht
E N D
Presentation Transcript
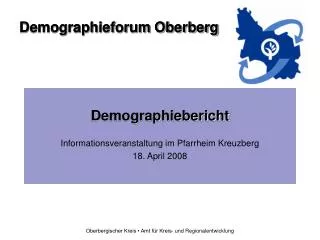
Demographiebericht Informationsveranstaltung im Pfarrheim Kreuzberg 18. April 2008 Oberbergischer Kreis • Amt für Kreis- und Regionalentwicklung
Oberbergischer Kreis • Amt für Kreis- und Regionalentwicklung
Land NW: +8% RBK: +10% +17% 1988 - 2000 1975 - 1987 2001 - 2006 Oberbergischer Kreis • Amt für Kreis- und Regionalentwicklung
- 5.667 + 1.573 - 2.039 1988 - 2000 2001 - 2006 1975 - 1987 Oberbergischer Kreis • Amt für Kreis- und Regionalentwicklung
1975 - 1987 2001 - 2006 1988 - 2000 Oberbergischer Kreis • Amt für Kreis- und Regionalentwicklung
+ 11.236 + 40.233 +2.268 1975 - 1987 2001 - 2006 1988 - 2000 Oberbergischer Kreis • Amt für Kreis- und Regionalentwicklung
+ 41.806 + 229 + 5.569 1988 - 2000 1975 - 1987 2001 - 2006 Oberbergischer Kreis • Amt für Kreis- und Regionalentwicklung
Oberbergischer Kreis • Amt für Kreis- und Regionalentwicklung
57,8 % 13,8 % Oberbergischer Kreis • Amt für Kreis- und Regionalentwicklung
Land NW: 10,6% RBK: 6,7% St. Köln: 16,9% Oberbergischer Kreis • Amt für Kreis- und Regionalentwicklung
OBK NRW OBK NRW OBK NRW OBK NRW OBK NRW OBK NRW Oberbergischer Kreis • Amt für Kreis- und Regionalentwicklung
2003 – 2002: -774 2004 – 2003: -625 2005 – 2004: -817 2006 – 2005: -1.022 --------- -3.238 = 130 Klassen à 25 Schüler Oberbergischer Kreis • Amt für Kreis- und Regionalentwicklung
Land NW: 9,4% RBK: 9,8% St. Köln: 8,8% Oberbergischer Kreis • Amt für Kreis- und Regionalentwicklung
2003 – 2002: +1.555 2004 – 2003: +1.744 2005 – 2004: +1.591 2006 – 2005: +1.089 ---------- +5.979 Oberbergischer Kreis • Amt für Kreis- und Regionalentwicklung
Land NW: 19,7% RBK: 20,9% St. Köln: 18,0% Oberbergischer Kreis • Amt für Kreis- und Regionalentwicklung
291.500 291.200 290.400 288.405 291.500 Oberbergischer Kreis • Amt für Kreis- und Regionalentwicklung
27.100 26.900 29.241 27.900 26.700 Oberbergischer Kreis • Amt für Kreis- und Regionalentwicklung
68.400 62.400 57.700 58.700 55.711 Oberbergischer Kreis • Amt für Kreis- und Regionalentwicklung