Download

1 / 24
250 likes | 402 Views
Explore the significance of the economic multiplier effect in Keynesian theory through detailed explanations and formula breakdowns. Learn about concepts such as MPC, MPM, and MPT in relation to national income determination and economic policy. Understand the impact of injections into the circular flow of income and how they contribute to overall economic growth.

E N D
The Multiplier Powerpoint produced by Rachel Farrell (PDST) & AoifeHealion (SHS, Tullamore) Source of information: SEC Marking Schemes
COLLATED EXAM QUESTIONS ORDINARY LEVEL HIGHER LEVEL
John Maynard Keynes (1883-1946) • Keynes lived during an era of great economic change and upheaval – the post-war changes in the 1920’s and the depression of the 1930’s, when there was a loss of faith in classical economic doctrine. • A new approach was sought by many governments and economists. • Keynes provided this alternative which has resulted in the modern mixed economy such as exists in Ireland and the UK today.
New Economic Concepts 1. The Multiplier • He developed new tools to explain his theories including the multiplier. • Any initial increase in spending will cause a much greater increase in GNP due to the fact that one person’s expenditure is another person’s income. He developed concepts such as: MPC, MPM, etc.
2. Output is demand determined.The size of national income depends on expenditure i.e. Y = C + I + G + X − M
Injection into the CFI Relationship The Multiplier Keynes National Income Increase
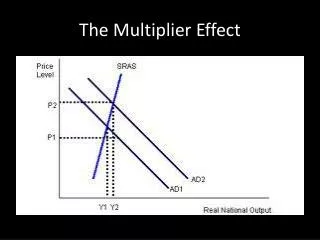
The Multiplier2006 Q 4 (b) (i) • Shows the precise relationship between an initial injection into the circular flow of income and the eventual total increase in national income. • Eg. • An in injection of 3 million may increase the NI by 6 million (multiplier = 2)
Formula 1 MPS + MPM + MPT or 1 1 - (MPC-MPM-MPT) Note: A closed economy will have no imports
MPC • Marginal Propensity to consume. • This is the portion of each additional unit of income which is spent. MPC = change in consumption change in income
MPM • Marginal Propensity to Import. • This is the proportion of each additional unit of income which is spent on imports. MPM = change in imports change in income
MPS • Marginal Propensity to Save. • This is the proportion of each additional unit of income which is saved. MPC = change in savings change in income
MPT • Marginal Propensity to Tax. • This is the proportion of each additional unit of income which is taxed. MPC = change in tax change in income
2006 HL Q 4 (b) Remember!
2005 HL Q 6 (b) MPS = 1 – MPC 1-0.9 = 0.1
2002 HL SQ 8 Change in C Change in Y 4, 050 – 3,750 4,600 – 4,200