Download
1 / 34
340 likes | 458 Views
Cyclical dynamics of NI House Prices Understanding Market Cycles. Prof. T.V Grissom, Dr. M. McCord, Dr. P.T Davis, Prof. W.S. McGreal & Dr. D. McIlhatton ERES Conference 2012 – Edinburgh. 2.Recessionary Environment?. NICE decade RUDE Awakening. 3.Property: a ubiquitous crisis factor?.

E N D
Cyclical dynamics of NI House Prices Understanding Market Cycles Prof. T.V Grissom, Dr. M. McCord, Dr. P.T Davis, Prof. W.S. McGreal & Dr. D. McIlhatton ERES Conference 2012 – Edinburgh
2.Recessionary Environment? NICE decade RUDE Awakening
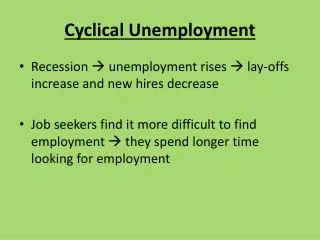
5.Rationale • Limited empirical analysis investigating stylised facts of the lead-lag relationships • Do any transmittal and endogenous shocks exist? • Is there interdependence or segmentation between different housing types in NI? • Do price movements in price transmission play a leading role in one type? • Assuming expectations of sub-sector price patterns this paper attempts to investigate endogenous time series components by: • focusing on the trends and cyclical relationships • concentrating on temporal lag patterns and autoregressive structures
6.Previous research • Holly et al. (2011) – price shock in London diffuses through the housing system & is highly co-integrated using generalised impulse response functions • Stevenson (2004) applied pairwise & multivariate co-integration plus Granger-causality tests • Close association between HM areas – instances of Granger causality • Chen et al. (2011) HP indices in Taiwan using generalised forecast error variance decomposition & impulse response • Bi-directional relationship HP in economic centre & surrounding hinterland – no Granger-cause
7.Previous research • Oikarinen (2006) – Johansen testing & VECM examining lead-lag price ripples • Price diffusion follows classic central place but also indicative of price change stemming from peri-urban to urban core • Luo et al. (2007) – VECM • One –directional cause between Sydney and Melbourne – hierarchy of price transmission • Tu (2000) limited Granger-causality between capital cities – ripple effect evident • Costello et al. (2011) – capital city HM’s segmented with regards to transmission of non-fundamental shocks
8.Previous research • Lee Kwang-tack (1996) – HP affect money supply through Granger-causality testing • Igan et al (2011) applying dynamic generalised factor model & spectral approaches • HP cyclicity and transmissions between residential investment, credit & IR’s • Stylised facts in that HP cyclicity leads credit & real activity over L-T; findings varied over S-T • IR’s tend to lag all other cycles at all time horizons • Rossini (2002) – testing price indices for regimes and cyclicity • Prices appear cyclical & consistent across dwellings • In terms of growth rate – price high variability and non-stationary • Suggestive of local demand and supply tastes & lead-lag structure across housing types
9.Previous Research • Hon-Chung Hui, (2011) - cyclical dynamics of landed and non-landed housing sub-markets in Malaysia • Granger-causality and impulse response • condominium price cycles lead the price cycles in other market sub-sectors by one to two quarters and predict the price diffusion across particular sub-sector markets • Chinloy (1996) Tuscan HM – sensitive to periodicity of cyclic behaviour – lags of 3 years • Grissom & DeLisle (1999) cyclic fluctuation is characterised by time delineated regimes
15.Correlations Chg Correlation
16.Decomposing to identify trends • Filters and Band-Pass Filters – unearth trends & cyclical components • BK: symmetric approximation – no phase shifts – expense is trimming series – MA isolates frequencies applying MA to approximate band-pass filters constrained to produce stationary outcome • H-P: smoothing method – minimization of variance – constrains variation of second order of growth component • CF approach develops optimal finite-sample approximations for the band-pass filter • CF model random walk filter uses the whole time series for the calculation of each filtered data point • Cross-correlation – Level of correlation between market segments across time – lead/lag • Granger- Causality – the causal nature of the relationships between the various house price cycles across time • Trend/Cycle Decomposition – Regimes - examine and separate the data phases into regimes, allowing for lag-lead observations and trend relations and variations within given segments or time (trends/regimes)
17.Research Design • Stationarity ‘the future will be like the past’ • Inspection for all housing sectors using a Correlogram show that on a price level basis the data is nonstationary temporally • First differencing = • Data – integrated by an I(d) level of I(1) • Also shows data to be of the AR form of AR(1) • First order AR(1):
19.Cycle decomposition • Differencing shows NI market to be a random walk of the form: where current price is an adaptive function of prior period (∓) disturbance term • Constructs enable a deconstruction of observed price data into trend component (non-cycle) and cycle component • Allows HP performance based on two different definitions of the business cycle as incorporated into band-pass filter modeling
20.Cycle decomposition2 • Generally the business cycle is identified as the stationary component • An alternative definition of the business cycle relies on an unobserved components (UC) view of an output: Yt = t + ct • this construct allowing for differencing can also be stated in the Hodrick-Prescott (HP) filter where the time series is decomposed into a growth component (gYt; trend slope) and an additive cyclical component (cYt; disturbance measure), where: yt = gYt + cYt • In the HP filter format, the growth component (gYt) is constructed as the second difference.
21.Decomposition Analysis • Data separated into regimes, allowing for lead-lag observations, trend relations & variations within given segments or time (trends/regimes) • Comparison of regime phases allows for the specification of similarities & differences between market periods of growth & decline • Temporal based regime segments are based on a quadratic structural form: • ⍺ = intercept or non-temporal component of time, βit = data sensitivity measure to time; = data sensitivity measure to difference or change and vit is the standard error of time trend forecast
22.Decomposition Analysis2 • The it is omitted from the deterministic expression of the quadratic time trend that is compared to the actual price observations at each point in time to create the time-based market disturbance measures. This calculation is all the form: T-t = ^yTt’ - yt or [+itt +itt2 - yt] • The T-t measure is thus compared to the forecast disturbance of it to achieve a stochastic adjustment measure operating in any defined regime phase.
23.Regime segmentation • Regime seg. Illustrates similar pricing growth and trend patterns across housing segments with variant, but associated cyclical disturbance terms • Summed regime segments compared with smoothing H-P filter • In boom phase spread in level of price & HP filter denote this variance (this is key) • Spread is differentiated by the disturbance/cyclical comp. • Allows for comparison of price estimates based on near-term rational expectations • Suggest a stochastic trend effect based upon adaptive expectations (lagged AR construct)
24.AR(p) MA(q) • ARMA’s first component is the autoregressive or AR term. The lagged value reflects the current market. An autoregressive model of order p, AR (p) has the form: • The second component is the moving average (MA) term. With an MA, the forecasting model uses lagged values of the forecast error to improve the current forecast. he error can reflect any newly introduced shocks to current housing markets. The MA (q) has the form:
25.CF Filter • ARMA relations addressed using CF band filter • Employed given dominance of trend effects operating across NI market • Full-term asymptotic (tends towards 0) model a better fit for the data than BK approach
H_P_DTBUNG H_P_DTHOUSE 26. H_P_SDHOUSE H_P_TERRACE
28. CF – filter analysis COMP_CF_DISTUR_GRAPH CORREL_CF_ERROR
29.Highlights of Approach and Results • Permits argument that sectors are segmented • Thus, trend (high correlations) are either a consequence of interdependence of local housing markets/housing capital – lead by detached & semi-detached housing – (a trickle down preference for housing!) • Non-Granger causality !! • Appears to be a contagion effect/impact here – higher correlations during the boom and bust periods – not stable market conditions as (95-04) • Contagion attributed to underwriting and financing – boom as well as bust • Usually a bust concept for segmented market with high correlations
30.What the paper does.... • Allows description of the trend & cycle components endogenous in the price time series • Techniques enable in-depth investigation of trend patterns & endogenous cycle components • Allows specification of stochastic pricing effects • Segmentation is shown to be ineffective by focusing on both the error term & tracking error • Insights into disturbance measures – calculated from the regime constructs & band pass filters
TE_CORREL TE_CORREL_APART
32.Key Findings • Lead period for detached property & semi-detached operate as price leaders • Lag period for apartments!!! Surprising!!! • All other housing tend to cluster and lag • Trickle down effect of housing wealth into other types! • Endogenous market distorted (segmented) by external forces • Signals • Contagion effect (behavioural) hot + cold markets • By type magnitude differs – heterogeneous choice • External factor causes similar expectations (boom and bust) financial tailoring; liberalisation
33.Key findings • Dominance of trend relationships measured & specified by comparing regime segments with HP calculated trends • HP filter– reflects adaptive expectations & behaviour in pricing • A story evident relating to diff market conditions (B/B) • Moving forward – associations lead us into quantifying B/B and bubbles • Regimes – exogenous measure of risk • Endogenous measure of risk (BP)
34.Conclusions • Decomposition of pricing behaviour into trend/cyclic component shows segmentation and distinctive markets • Segmentation infers that interdependence is a result of contagion effects • Supported by recognition of lags • Contagion dominates during boom/bust periods • Regardless of impact of contagion for interdependency on pricing behaviour a deterministic/stochastic trend effect dominates pricing across typologies • This suggested deterministic trend (non stationary - time sensitive trends and stationary disturbance - random walk cycle components - with form AR(1) and I(d)/I(1) • Segmentation endogenously operating in the price structure based on differences in the cycle/disturbance components with first differencing adjustment (1 to 2 period lags) in operation • Nonstationary cyclical component based on unit root factor & differencing requirement supports: • Adaptive lag pricing and random walk construct • Allows NI market to be structured & forecast based on deterministic trend component & stationary cycle effect