
Uploaded by
huyen
4 SLIDES
156 VIEWS
40LIKES
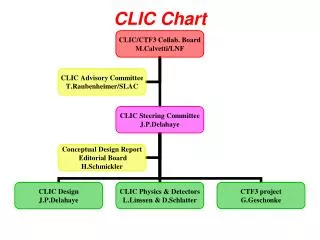
Data Visualization Made Easy with CLIC Chart
DESCRIPTION
The CLIC Chart is a powerful tool designed for both beginners and advanced users to create stunning data visualizations effortlessly. With its user-friendly interface and customizable features, you can turn raw data into beautiful charts that tell a clear story. Whether you're analyzing business metrics, scientific data, or personal projects, CLIC Chart offers the flexibility and functionality you need. Start transforming your data today and bring your insights to life!
Download
1 / 4
Download Presentation 
Data Visualization Made Easy with CLIC Chart
An Image/Link below is provided (as is) to download presentation
Download Policy: Content on the Website is provided to you AS IS for your information and personal use and may not be sold / licensed / shared on other websites without getting consent from its author.
Content is provided to you AS IS for your information and personal use only.
Download presentation by click this link.
While downloading, if for some reason you are not able to download a presentation, the publisher may have deleted the file from their server.
During download, if you can't get a presentation, the file might be deleted by the publisher.
E N D


More Related
Audio
Live Player