
10/3 Interpret Data
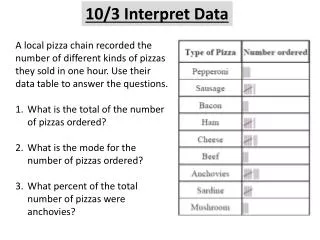
10/3 Interpret Data. A local pizza chain recorded the number of different kinds of pizzas they sold in one hour. Use their data table to answer the questions . What is the total of the number of pizzas ordered ? What is the mode for the number of pizzas ordered ?

10/3 Interpret Data
E N D
Presentation Transcript
10/3 Interpret Data • A local pizza chain recorded the number of different kinds of pizzas they sold in one hour. Use their data table to answer the questions. • What is the total of the number of pizzas ordered? • What is the mode for the number of pizzas ordered? • What percent of the total number of pizzas were anchovies?
10/3 Slylock Stolen Diamonds Diamonds were stolen from the Forest Jewelry Store. A witness reported seeing Harry Ape snatch the jewels. After obtaining a warrant, Chief Mutt and Deputy Duck searched Harry's house but were unable to find the diamonds. Slylock Fox found the diamonds after a quick look around the room.
10/7 Making Claims Based on Data A type of feed claims to boost the growth rate of cows. The feed is tested on two twin newborn cows. Bessie receives the experimental feed, and Bertha receives regular corn feed. Their weights are recorded below. Did the experimental feed change the way they gained weight at all? Make a claim and support it with evidence from the data. Graph the data below. Use a dotted line for Bessie and a straight line for Bertha. Make sure you label the X and Y Axis of the graph. 400 350 300 250 200 150 100 April May June July Aug April May June July Aug
10/10 Analyze Data An experiment studies the effects of an experimental drug on the number of offspring a mother mouse has. 10 female mice are given the drug and then impregnated. The number of mice in their litters is compared to the litters of mice that did not take the drug. What is the mean number of babies born of each group? What is the mode for each group? Write a claim about the drug and its affect on the number of babies per litter. Support your claim with evidence. What is the dependent variable for this experiment?
10/10 Dot Challenge • Connect each of the dots with four straight lines. • Each dot must be crossed once, but not more than once, and you cannot lift your pencil from the paper once you have started.
10/14 Interpret Data and Make a Claim 18-to-24-Year-Old Men and Women Enrolled in College, 1967-2005 State a claim about this graph and support it with evidence. (two sentences)
10/16 Properties of Matter Matter can be in the form of a solid, a liquid or a gas. • Divide your paper into three columns and write one of the states of matter in each of the three columns. • Then list as many properties of each state of matter you can think of. Solid Liquid Gas
10/17 Slylock Drive-In Robbery As SlylockFox and Max Mouse sat in their cars at Forest Drive-In, someone was robbing the projectionist. Without stopping the movie, How did the projectionist send a signal that aroused Slylock’s curiosity and caused him to investigate?
10/18 Effects of Heating a Liquid Explain the effects of heating a liquid using the words molecules, expand and gas.
10/21 Effects of Heating a Liquid • Which statement do you agree with more? Use a complete sentence to state your claim. Then explain your thinking.
10/22 Volume and Temperature This graph shows the relationship between temperature and volume in a gas. Write a claim about what happens to the volume of a gas when temperature rises. Then support your claim with quantitative evidence.
10/23 Numbers Challenge The challenge in this puzzle is to place the numbers 1-8 in the rectangles below so that no two consecutive numbers are next to each other horizontally, vertically, or diagonally. For example, if the 5 is placed in the far left box, then the 4 or 6 can't be placed in the box directly to the right of the 5 or the two boxes that are diagonally above and below the 5.
10/24 Bar Graphs Bar graphs are used to compare quantitativedata and qualitativedata. The quantitative data goes on the Y-Axis while the qualitative data goes on the X-Axis. Place a red “X” on the X-Axis and a Blue “Y” on the Y-axis of the bar graph on the right. 2. Make a claim based on the data represented in this graph. Then support your claim with evidence. Remember to analyzethe data using your math skills to support your claim. Don’t just recite numbers from the graph.