Water Pollution 4.4
Water Pollution 4.4. Applications and Skills. Analyze water pollution data Explain the process and impacts of eutorophication Evaluate the uses of indicator species and biotic indices in measuring aquatic pollution Evaluate pollution management strategies with respect to water pollution.

Water Pollution 4.4
E N D
Presentation Transcript
Applications and Skills • Analyze water pollution data • Explain the process and impacts of eutorophication • Evaluate the uses of indicator species and biotic indices in measuring aquatic pollution • Evaluate pollution management strategies with respect to water pollution
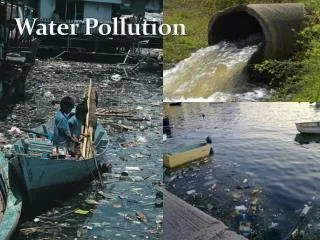
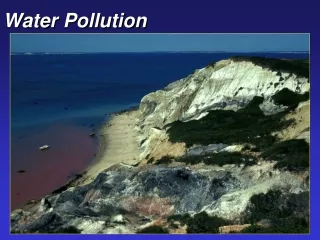
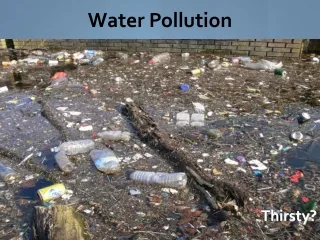
Types of Water Pollution • Anthropogenic (created by humans) or natural Red tide caused by algae bloom. Usually toxic to shellfish and other marine organisms Anthropogenic water pollution (solid domestic waste)
Types of Water Pollution • Point Source or Non-point source
Types of Water Pollution • Organic or Inorganic Human and animal waste are examples of organic waste entering waterways Oil spill clean up in Sundarbans 2015. This is an example of inorganic waste
Types of Water Pollution • Direct or Indirect Dumping dye and other toxins into waterway as disposal method from textile industries in Bangladesh Excess nitrates enter waterways from agricultural fertilizers causing algal blooms (eutrophication)
Sources of Water Pollution • Sewage (human/animal) • Pesticides • Chemicals from industries • Pathogens • Nitrates (fertilizers) • Phosphates (detergents) • Heavy metals (industry) • Oil spills • Heat (thermal pollution from electrical stations/desalination • Radioactive waste • Solid domestic waste (trash & debris) • Suspended particles (from runoff/erosion or construction) • Invasive species (ex: Cane Toad)
Possible Effects of Water Pollution • Eutrophication • Loss of biodiversity (species and habitat) • Incrase in disease from pathogens and exposure to toxins or radiation • Bioaccumulation and biomagnification in food webs • Disruption to breeding grounds, nesting sites • Damage to coral reefs • Damage to organisms (ingesting plastics, caught in debris, etc)
Measuring Water Pollution There are many direct methods to measure water quality: • pH • Conductivity (may indicate dissolved pollutants in water or presence of heavy metals) • Dissolved Oxygen (DO) • Nitrates or Ammonia • Turbidity • Fecal Coliform Test
Measuring Water PollutionIndirect Measures Biochemical Oxygen Demand (BOD) • The amount of dissolved oxygen required for decomposers to aerobically break down organic matter in a given volume of water • If enough oxygen is present, aerobic decomposition by microorganisms will continue until all waste is consumed • Dissolved oxygen should measure initial amount of oxygen in sample. • Sample of water should be kept sealed and in the dark • After 5 days a second DO reading should be recorded • Calculate the change in oxygen levels (this is the amount of oxygen that has been used/demanded by microbes for decomposition) • Unpolluted, natural waters have a BOD of 5 mg/L or less
Measuring Water PollutionIndicator Species • Organisms that show something about their environment by their abundance or scarcity • These species are sensitive to changes in an environmental factor so are often an early indicator of the health of the ecosystem
Measuring Water PollutionIndicator Species • In freshwater ecosystems, the following are often indicators of the water quality • Frogs and Toads have permeable skin so are affected by water pollutants and only present in clean water • Mayfly larva indicate clean water • Water Louse indicates polluted water • Sludgeworms indicate very polluted water
Measuring Water Pollution Biotic Indices (ex: Trent Biotic Index) • An indirect measure of pollution by determining the relative abundance of organisms present and classifying them by tolerance levels (look at both the diversity and the abundance by tolerance) • A scall of 1-10 is used to give a measure of the quality of the ecosystem • Often used in conjunction with BOD as invertebrates are sensitive to decreases in oxygen concentration • Often used to compare 2 ecosystems of point source pollutants as a comparison using Simpson’s diversity index can be used to support • Measures the effect of pollutants on biodiversity, not the pollutant itself.
Measuring Water Pollution Biotic Indices (ex: Trent Biotic Index)
Eutrophication • Occurs when excess nutrients enter an aquatic ecosystem resulting in a drastic increase in algae growth • May happen in freshwater or oceans (red tides) • Natural or anthropogenic • Humans influence eutrophication through using fertilizers (nitrates) and detergents containing phosphates and sewage.
Process of Eutrophication • Fertilizers or detergents wash into river or lake • High levels of nitrates and/or phosphates lead to increased algal and plant growth • Algal blooms block sunlight from penetrating deeper into the lake • More producers result in increase in consumer populations • Plants not on surface die due to lack of sunlight • Decomposer population grows significantly • Increased decomposition and consumer population leads to decreased DO • Due to low levels of oxygen everything begins to die • May result in dead zones (in oceans or freshwater)
Impacts of Eutrophication • Anaerobic (anoxic) water • Loss of biodiversity • Death of aerobic organisms • Death of plants • Increased turbidity • Produce toxic (and smelly) gases such as methane, hydrogen sulfide, and ammonia (due to anaerobic decomposition)
Red Tides • When algal bloom occur due to an increase in dinoflagellates (a type of plankton • Causes water to look red • Danger due to toxins produced by dinoflagellates that kill fish and accumulate in shellfish • If humans eat the shellfish during a red tide it will make them very sick
Management Strategies for Eutrophication • Altering Human Activity • Ban/limit detergents containing phosphates • Plant buffer zones between agricultural lands and water bodies • Prevent leaching of sewage into waterways • Educate farms about effective timing of fertilizer application • Regulating and Reducing Pollutant at Point of Emission • Treat wastewater to remove phosphates and nitrates • Divert and treat sewage • Minimize fertilizer dosage or use organic matter • Clean up and Restoration • Pump oxygen into lakes (re-oxygenate) • Dredge sediment from river and lake beds • Remove excess weeds • Restock pond with appropriate organisms