Download
1 / 1
10 likes | 170 Views
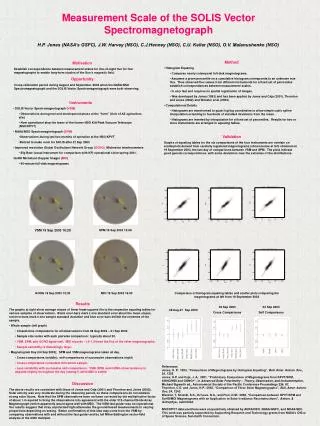
Measurement Scale of the SOLIS Vector Spectromagnetograph. H.P. Jones (NASA’s GSFC), J.W. Harvey (NSO), C.J.Henney (NSO), C.U. Keller (NSO), O.V. Malanushenko (NSO). Method Histogram Equating Compares nearly cotemporal full-disk magnetograms.

E N D
Measurement Scale of the SOLIS Vector Spectromagnetograph H.P. Jones (NASA’s GSFC), J.W. Harvey (NSO), C.J.Henney (NSO), C.U. Keller (NSO), O.V. Malanushenko (NSO) • Method • Histogram Equating • Compares nearly cotemporal full-disk magnetograms. • Assumes a given percentile on a cumulative histogram corresponds to an unknown true flux. Thus observed flux values from different instruments for a fixed set of percentiles establish correspondences between measurement scales. • Is very fast and requires no spatial registration of images. • Was developed by Jones (1993) and has been applied by Jones and Ceja (2001), Thornton and Jones (2002) and Wenzler et al. (2004) • Computational Details • Histograms are transformed to quasi log-log coordinates to allow simple cubic spline interpolation extending to hundreds of standard deviations from the mean. • Histograms are inverted by interpolation for a fixed set of percentiles. Results for two or more instruments are arranged in equating tables. • Validation • Graphs of equating tables for the six comparisons of the four instruments are overlain on scatterplots derived from carefully registered magnetograms (shown below at left) obtained on 19 September 2003, the last day of comparisons between VSM and SPM. The plots indicate good general correspondence, with some deviations near the extremes of the distributions. Motivation Establish correspondence between measurement scales for line-of-sight flux for four magnetographs to enable long-term studies of the Sun’s magnetic field. Opportunity Cross-calibration period during August and September, 2003 when the NASA/NSO Spectromagnetograph and the SOLIS Vector Spectromagnetograph were both observing. • Instruments • SOLIS Vector Spectromagnetograph (VSM) • Observations during test and development phase at the “farm” (Univ of AZ agriculture site) • Now operational atop the tower of the former NSO Kitt Peak Vacuum Telescope (NSO/KPVT) • NASA/NSO Spectromagnetograph (SPM) • Observations during last two months of operation at the NSO/KPVT • Retired to make room for SOLIS after 21 Sep 2003 • Improved resolution Global Oscillations Network Group (GONG) Micheslon interferometers • Big Bear (usual instrument for comparison with KP) operational since spring 2001. • SoHO Michelson Doppler Imager (MDI) • 90-minute full-disk magnetograms VSM 19 Sep 2003 16:28 SPM 19 Sep 2003 15:09 GONG 19 Sep 2003 15:30 MDI 19 Sep 2003 16:00 Comparison of histogram equating tables and scatter plots comparing the magnetograms at left from 19 September 2003 • Results • The graphs at right show average slopes of linear least-squares fits to the respective equating tables for various samples of observations. Black error-bars mark ± one standard error about the mean slopes, red error-bars mark ± one sample standard deviation and blue error bars delimit the extremes of the sample. • Whole sample (left graph) • Closest-time comparisons for all observations from 08 Aug 2003 – 21 Sep 2003 • Sample size varies with each pairwise comparison: typically about 30. • VSM, SPM, and GONG agree well; MDI records ~1.4-1.5 times the flux of the other magnetographs. • Sample variability is disturbingly large. • Magnetogram Day (04 Sep 2003); SPM and VSM magnetograms taken all day. • Cross-comparisons (middle); self-comparisons of successive observations (right) • Cross-comparisons consistent with whole sample. • Less variability with successive self-comparisons. VSM, SPM, and GONG show tendency to degrade slightly throughout the day (seeing?) while MDI is stable. • Discussion • The above results are consistent with those of Jones and Ceja (2001) and Thornton and Jones (2002). Solar activity was very moderate during the observing period, so these comparisons do not address strong solar fluxes. Note that the SPM observations have not been corrected by the multiplicative factor of about 1.4 required to bring the observations into agreement with the older 512-channel Diode Array Magnetograph (which apparently would agree well with MDI). The VSM fast guider was not operational. Our results suggest that stray unpolarized light attenuates the ground-based measurements in varying proportions depending on seeing. Better confirmation of this idea may come from the VSM by comparing observations with and without the fast guider and by full Milne-Eddington vector-field analysis of the 6302 multiplet. 04 Sep 2003 Cross Comparisons 04 Sep 2003 Self Comparisons 08 Aug-21 Sep 2003 References Jones, H. P.: 1993, “Comparison of Magnetograms by Histogram Equating”, Bull. Amer. Astron. Soc., 24, 1252. Jones, H.P. and Ceja, J. A.: 2001, “Preliminary Comparison of Magnetograms from KPVT/SPM, SOHO/MDI and GONG+”, in Advanced Solar Polarimetry -- Theory, Observation, and Instrumentation, Michael Sigwarth ed., Astronomical Society of the Pacific Conference Proceedings 236, 87. Thornton, C.E. and Jones, H.P.: 2002, “Comparison of Three Solar Magnetographs”, Bull. Amer. Astron. Soc. 34, 1243. Wenzler, T, Solanki, S.K., Krivova, N.A., and Fluri, D.M.: 2004, “Comparison between KPVT/SPM and SoHO/MDI Magnetograms with an Application to Solar Irradiance Reconstructions”, Astron. & Astrophys., submitted. NSO/KPVT data used here were cooperatively obtained by AURA/NSO, NASA/GSFC, and NOAA/SEC. This work was partially supported by Supporting Research and Technology grants from NASA’s Office of Space Science, Sun-Earth Connection.