
Data Quality Analysis of Muon Efficiency in Multiple Runs
This report presents a detailed analysis of data quality histograms and muon efficiency across several runs identified in the DQ logbook (reference run 111976). The runs examined include 111955, 111846, and 112254, highlighting significant findings such as large inefficiencies at the borders, differences in the ROOT files, and variations in efficiency due to background noise under the Minimum Ionizing Particle (MIP) peak. The results indicate that 'bad' runs exhibit fewer candidates and a higher background count, necessitating further investigation into the correlation with pseudorapidity.

Data Quality Analysis of Muon Efficiency in Multiple Runs
E N D
Presentation Transcript
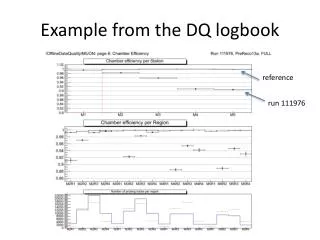
Example from the DQ logbook reference run 111976
List of run numbers affected runs with dataquality histograms 11/4/2012 run fill tck #files #muoneff in M5 112254 2508 0x008C0040 123 33M 97% 112250 2508 0x008C0040 20 3.4M 97% 112249 2508 0x008C0040 109 30M 95% 112248 2508 0x008C0040 29 4.8M 97% 112191 2505 0x008C0040 15 1934649 91% 112186 2505 0x008C0040 36 7.6M 90% 112180 2505 0x008C0040 9 802522 90% 112177 2505 0x008C0040 8 1070398 90% 112176 2505 0x008C0040 8 1068069 90% 112148 2501 0x008C0040 110 17M 90% 112146 2501 0x008C0040 43 2507056 90% 111982 2500 0x00860040 29 5.5M 91% 111980 2500 0x00860040 9 398254 91% 111976 2500 0x00860040 13 1670469 91% 111960 2500 0x00860040 14 2103611 90% 111957 2500 0x00860040 27 5464296 90% 111956 2500 0x00860040 23 4168515 90% 111955 2500 0x00860040 140 23M 91% 111846 2493 0x00860040 19 3133647 99% 111845 2493 0x00860040 7 571359 99% 111829 2493 0x00860040 7 1364 99%? 111828 2493 0x00860040 7 1033 99%? 111827 2493 0x00860040 7 23408 99% 111794 2491 0x007F0040 10 125951 92% 111779 2490 0x007E003A 7 0 111778 2490 0x007E003A 10 1053417 94% 111777 2490 0x007E003A 10 1050051 92% 111772 2490 0x007E003A 18 1128899 91% 111689 2486 8 530082 95% (hotspot in isMuon@M2) 111685 2486 8 116857 90% (hotspot in isMuon@M2) 111684 2486 8 39806 88% (hotspot in isMuon@M2) 111683 2486 8 100897 91% (hotspot in isMuon@M2) 111682 2486 8 27251 94% (hotspot in isMuon@M2) 111681 2486 8 96183 91% (hotspot in isMuon@M2) 111470 2482 44 503705 91% (hotspot in isMuon@M2) 111463 2482 8 1082220 91% (asymmetric isMuon@M2) 111462 2482 8 883031 90% (asymmetric isMuon@M2) 111460 2482 8 736307 90% (asymmetric isMuon@M2)
Momentum dependence M1 M2 M3 M4 M5 Could just be a correlation with pseudorapidity
run 111955 Note large inefficiencies at the border
some more differences in the ROOT file run 111846 run 111955 run 112254 renormalized to same number of entries ‘bad’ runs have fewer candidates, more BG under MIP peak
DVmonitormuid efficiencies run 112254 run 111846 run 111955 For all three runs more BG, lower efficiency