Download
1 / 43
430 likes | 505 Views
Explore the law of demand and its impacts on consumer behavior through income and substitution effects, and diminishing marginal utility.

E N D
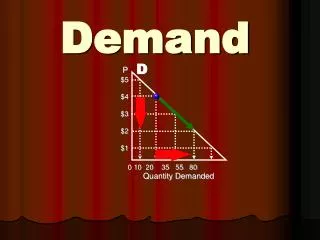
Demand D P $5 $4 $3 $2 $1 0 10 20 35 55 80 Quantity Demanded
D Three Reasons Why the Law of Demand Exists P1 P2 QD1 QD1 • Income Effect • When things are expensive, money buys less • When things are cheap, money buys more • Substitution Effect • When apples are expensive and their substitutes (pears) are relatively cheap, I buy fewer apples and more pears • Diminishing Marginal Utility • Each additional unit of an item purchased gives less marginal utility (happy points) than the previous unit. Therefore, the only way I will buy more is if the price is lower. • Ex. When I’m hungry, I typically will buy2 breakfast tacos. The reason I don’t buy a third taco is because the marginal utility of the third taco is less than the price of the taco. But, if the price of the taco is less than the marginal utility of the taco, then I will buy the third taco
Demand [Curve] Demand Can Increase or Decrease “Change in Demand (curve)” [“TIMER] 6 5 4 3 2 1 0 P D2 Demand Schedule D1 D3 Individual Demand P Qd Increase in Demand $5 4 3 2 1 10 20 35 55 80 Price (per bushel) Decrease in Demand Q 2 4 6 8 10 12 14 16 18 Quantity Demanded (bushels per week) Demand is a whole bunch of QDs strung together.
Let’s take a look at some examples of “Diminishing Marginal Utility”
Disutility [or negative utility]? . I ate one hamburger, and it tasted great. The next two tasted okay. I wish I hadn’t have eaten the 5th. I can’t finish the 6th. About this time there is toilet trauma. Or, “inconvenienced afterward”. DIMINISHING MARGINAL UTILITY Utility(satisfaction)decreases as more of the same product is consumed.
“OK, it doesn’t taste so great” “Diminishing Marginal Utility”
Too Much Relief? I’ll pay you $1 to drink another glass.
NS 1-10 1. (Demand/Supply) is identified as quantities consumers are willing and able to buy at various prices during a given time period. 2. The law of demandsays thatprice & QD are (directly/inversely)related. 3. The most important variable influencing decisions to produce and purchase goods is (technique/price). (Price/income) is not held constant when moving along a stable demand curve. 4. Incomeeffect-the increase or decrease in purchasing power brought on by a change in (taste/market size/price). 5. Substitution effect – tendency to substitute a (higher/lower) -priced product for a more expensive product. 6. Diminishing marginal utility – utility, or (determination/anger/satisfation) decreases as more of the same product [Snickers] is consumed. 7. The law of demandrefers to a(movement/shift)along a demand curve. 8. Substituting chicken as the price of steak goes up is an example of the (income/substitution) effect. 9. When the price of caviar falls, the purchasing power of our money income rises & thus permits us to purchase more caviar. This is the (income/substitution) effect. 10. The demand(curve/schedule)is anumerical tabulationshowing QD at each price. The demand(curve/schedule)is agraphical representationof the law of demand.
Elastic or Inelastic(Total Receipts Test) $2 $1 Elastic Inelastic 20 30 40 50 Total Receipts Test 20 x $2 = $40 Total Receipts Test 20 x $2 = $40.00 50 x $1 = $50 30 x $1 = $30.00
11.Elasticity of D – the way price affects QD.12.Elastic- QDthat isvery responsive to price.13.Inelastic- achg in price has littleimpact on QD. • Elastic (flexible) Demand • Substitutes (butter) • Luxury(mink coat) • Expensive(car) • Has durability(refrigerator) • Lasts a long time (gas-guzzling car) • Inelastic (inflexible) Demand • No substitutes(milk) • Necessity(insulin) • Inexpensive(safety pin) • No durability(pencil) • Lasts only a short time(bread)
Elastic Demand For Cassette Tapes . “TR” Test $2.50x100,000=$250,000 $1.50x600,000=$900,000 +$650,000 D -$1
D “TR” Test $2 = $30 bil. $1 = $20 bil. -$10 bil. -$1 +25% QD
. Elastic/InelasticDemand Think of “responsiveness” as “flatness”.
Estimating the Elasticity of Demand3 Key Questions:1. Subs? 2. Necessity? 3. Expensive?
Change in “Demand” [curve][“TIMER”] . Consumers change their minds at each and every price. Based on good or bad publicity about OJ. 16 oz. Orange juice = 220 calories 16 oz. Tomato juice = 78 calories
Quantity Demandedvs.Demand Quantity Demanded [QD] is triggered by a price change. QD is the quantity of a good/service thatpeople will purchase at a specific priceat a given time. Demand [D] is triggered by “TIMER” [non-price]. A schedule of the total quantities of a good or service thatpurchasers will buy at different pricesat a given time. Demandis abunch of QD’s strung together.
“Demand Shifters” [TIMER] 1. Taste [direct] 2. Income [normal-direct] [inferior-inverse] 3. Market Size [number of consumers-direct] 4. Expectations [of consumers about future *price-direct, about future availability-inverse, or about future income–direct. 5. Related Good *Prices [substitutes-direct] [complements-inverse] D D1 D1 D2 P1 D1 D3 D2 D2 P P P2 P QD2 Complement [inverse] QD1 Substitute [Direct] Bread Butter Bagels Change in “D” [curve] 1. Non price change[“TIMER”] 2. Whole “D” curve shifts [There is a change in “QD” but it is not caused by a change in “price.” [QD-”singleprice”; D-”all prices”] QD3 QD2 QD1
Change in “Taste” D1 D2 D3 P Mini Skirts Hip Huggers Bell Bottoms QD1 Platforms QD3 QD2 1. An “Increase in Taste” shifts the D curve right a. The Nehru jacket came & went in 6 months. b. Jordache Jean demand created by TV c. Leisure suits and bell bottoms. d. Technological change may cause consumer taste to change [slide rules]. Jordache
2. Change in Income Normal Good – goods whose demand variesdirectlywith income. Inferior Good – goods whose demand variesinverselywith income. Butter, filet, steel-belts, new clothing & new cars v. Margarine, spam, used tires, old clothing & old cars Demand For Steak Income Demand For Spam
The Impact of a Change in Income As the recession worsened in 2010, spam companies put in two shifts of workers cranking out Spam 7 days a week. A 12-ounce can that doesn’t require refrigeration and can last for years cost only $2.40. At least families are putting something on the table resembling meat. • Higher income increases the demand for normal goods • Higher income decreases the demand for inferior goods
3. Change in Market Size [Direct] [Number of Consumers] D2 D1 More demand for both normal and inferior goods. P QD1 QD2
3. Market Size (direct) (# of consumers) can increase/decrease from economic decisions, advertising, and government political decisions (China). Ex: The large “baby boom” of 1946-64 increased the demand for baby supplies. An increase in life expectancy increased demand for for medical care, retirement communities, and nursing homes. Increase in # of consumers
4. Expectations [of consumers] [about future price, availability, & income] If the iPad is expectedto increase in price from $499 to $799. D2 D1 P iPad QD1 QD2
4. Expectations [of consumers] [about future income] Let’s say that we are coming out of recession & consumers feel secure about their jobs. [Positive future income] D2 D1 P QD1 QD2
4. Expectations [of consumers] [about future income] Let’s say that we are going into a recession and consumers don’t feel secure about their jobs. [Negative future income] D1 D2 P QD2 QD1
4. Consumer Expectations car Consumer expectationsabout future product price, future availability, & future income. Ex: When the Korean War broke out in the summer of 1950, newcar sales boomed(also washers and refrigerators) out of the expectation of a production stoppage like during WWII. None occurred but it was the expectation that affected new car demand.
5. Prices of Related Goods [Substitutes-Direct;Complements-Inverse] D1 D2 D D1 P1 D2 P P P2 Complement [Inverse] QD1 QD2 Substitute [Direct] Gangsta Grills Chrysler 300s Toyotas MV X PQ
There are three types of goods. • Independent goods – price change • of one hasno impacton the other. • Ex: fishhooks and pantyhose or salt and shoelaces • 2. Substitute goods(“competing goods”) • - price change of one affects the • demand of the other directly. • Ex: 7Up & Coke or Miller & Bud • 3. Complementary (“go together”) • - price change of one affects the • demand for the other inversely. No, I want to learn econ. 5. Prices of Related Goods No demand for beer Beer BL Student D1 D2 QD2 QD1 Peanut butter & jelly D2 D1 Camera Film Cereal&milk Coffee & donuts QD1 QD2
[Increase in priceof one;increasein “D” of the other] Substitutes - DIRECT Demand for Dr Pepper Price Of 7UP D2 D1 D P P2 P1 QD QD QD2QD1
[Decreasein price of one; increase in the “D” for the other] Complements - INVERSE P1 P2 QD1QD2 D1 D2 Boat Prices P QD QD Gasoline Demand No change in price I’m making more money without dropping my prices. They are so cheap that even dogs are buying boats
Effect of Demand for Cigarettes . Ok, so I’m only 17. This is how cigarettes age you. ? P • The price of cigarettes are expected • to increase sharply in the future. • 2. Substantial increase in market size • affect the demand for cancer sticks. • 3. A cure for lung cancer impacts the • demand (taste) for cancer sticks. • 4. Cigar prices increase which affect the • demand for cigarettes(a substitute). • 5. The surgeon general has just warned that • smoking causes cancer, severe facial • wrinkles, ashtray breath, ashtray smelling • clothes & hair, chronic cough, yellow teeth, • impotency, and ugly warts all over the lips. +D +D +D +D -D
. Substitute/ComplementRelationships “Substitutes” D1 D D2 P1 P Price Decreases Price Decreases P2 QD2 QD1 QD1 QD2 [DIRECT] Hamburgers Hot Dogs “Complements” D D2 D1 Demand Increases Price Decreases P1 P P2 QD1QD2 QD1 QD2 [inverse] Syrup Pancakes
Change in QD [“Change in “PRICE”] Increase in “QD” [caused by a “decrease in price”] Decrease in “QD” [caused by an “increase in price”] D D 1. Price change 2. Movement 3. Point to point [“Snap shot of 1 pt in time] P1 P2 P2 P1 QD1 QD2 QD2 QD1 Change in “D” [“TIMER”] D2 D1 D1 1. Non-price 2. Whole curve 3. Shift [“Time passes”] D2 P P “Decrease in D” “Increase in D” What could cause an “increase in Demand?” 5.Expectations of a shortage 1. Increase in taste 6. Expectations of a price increase 2 .Increase in income [normal good] 7. Expectations of positive future income 3. Decrease in income [inferior good] 8. Incr in price of a substituteforproduct “X” 4. Increase in market size[# of consumers] 9. Decrin price of acomplementof product “X”
QD& DPractice Quiz[Snickers] 1. What would cause an “increase in QD” for Snickers? a. increase in number of consumers b. decrease in the price of Snickers c. decrease in income d. increase in the price of Snickers 2. What would cause an “increase in D” for Snickers? a. increase in taste for Snickers b. decrease in the price of Snickers c. decrease in income d. increase in the price of Snickers 3. What would cause a “decrease in QD” for Snickers? a. increase in taste for Snickers c. decrease in the price of Snickers b. Increase in # of consumers d. increase in the price of Snickers 4. What would cause a “decrease in D” for Snickers? a. decrease in income c. increase in the price of Snickers b. increase in taste d. decrease in the price of Snickers 5. An “increase in the price of Butterfingers would cause a(n) (increase/decrease) in (QD/D) for Snickers?
NS 1-10 1. (Demand/Supply) is identified as quantities consumers are willing and able to buy at various prices during a given time period. 2. The law of demandsays thatprice & QD are (directly/inversely)related. 3. The most important variable influencing decisions to produce and purchase goods is (technique/price). (Price/income) is not held constant when moving along a stable demand curve. 4. Incomeeffect-the increase or decrease in purchasing power brought on by a change in (taste/market size/price). 5. Substitution effect – tendency to substitute a (higher/lower) -priced product for a more expensive product. 6. Diminishing marginal utility – utility, or (determination/anger/satisfation) decreases as more of the same product [Snickers] is consumed. 7. The law of demandrefers to a(movement/shift)along a demand curve. 8. Substituting chicken as the price of steak goes up is an example of the (income/substitution) effect. 9. When the price of caviar falls, the purchasing power of our money income rises & thus permits us to purchase more caviar. This is the (income/substitution) effect. 10. The demand(curve/schedule)is anumerical tabulationshowing QD at each price. The demand(curve/schedule)is agraphical representationof the law of demand.
NS 11 - 20 11. Elasticity ofdemand–the way price affects(attitude/quantity/market size). 12. (Inelastic/Elastic) demand – demand that is very responsive to price. [A small price increase causes a large decrease in quantity demanded.] 13. (Inelastic/Elastic) demand-when a change in price has little impact on QD. 14. The 3-item test for elastic demand are substitutes, luxury items, and (inexpensive/expensive) items. 15. The 3-item test for inelastic demand are no substitutes, necessities, and (inexpensive/expensive) items. 16. Expensive cars have (inelastic/elastic) demand. 17. Pepsi Cola has (inelastic/elastic) demand. 18. Insulin has (inelastic/elastic) demand. 19. The elastic demand curve is more (horizontal/vertical).[much change] 20. The inelastic demand curve is more (horizontal/vertical).[not much change]
NS 21-26 21. With the invention of the calculator, the demand curve for the slide rule (increased/decreased). 22. When Forest Gump went to China & the U.S. followed by opening up relations with China, the demand curve for Coke (increased/decreased). 23. An increase in income would (increase/decrease) the demand for used clothing. [inferior good] 24. A decrease in income would (increase/decrease) the demand for lobster. [normal good] 25. A decrease in the price of product X[lumber] will (incr/decr) the demand for the complementaryproduct Y. [nails] 26. After Brooke Shields[15] did her national TV ads[“Nothing comes between me and my Calvin’s”], the “D” curve moved (right/left). $45
NS 27-38 27. An increase in the price of Pepsi causes the demand curve for Coke to move to the (right/left). 28. If there is a sale on shirts, the demand curve for ties will move to the (right/left). 29. If a man’s workplace is about to close down, his demand curve for major purchases would move to the (right/left). 30. If a cure for lung cancer were found, the demand curve for cigarettes would move to the (right/left). 31. If the price of pancakes decreases, the demand for syrup, a complement, will (increase/decrease). 32. If the price of butter decreases, the demand formargarinewill (incr/decr). 33. A “change in QD” is caused by (price change/TIMER)[a “movement”] 34. A “change in D” is caused by (price change/TIMER) [a “shift”] e
Increase in Demand [curve] [caused by “TIMER”] Increase in Demand [curve] 1. Increase in Taste 2. Increase in income [normal good] 3. Decrease in income [inferior good] 4. Increase in # of consumers 5. *Consumer expectationsof a price increase 6. Consumer expectations ofa shortage 7. Consumer expectations of positive future income 8. *Increase in the price of a substitute[direct] for productX 9. *Decrease in the price of a complement [inverse] for productX D2 P D1 Decrease in D 1. Decrease in Taste 2. Decrease in income [normal good] 3. Increase in income [inferior good] 4. Decrease in # of consumers 5. *Consumer expectationsof a price decrease 6. Consumer expectations oflarge surpluses[price will fall] 7. Consumer expectations of negative future income 8. *Decrease in the price of a substitute[direct] for product X 9. *Increase in the price of a complement [inverse] for productX QD1 QD2 Quantity “D”is a whole bunch of QD’s strung together.