Streamlining Operations for Efficiency Improvement in Manufacturing Plants
200 likes | 330 Views
Learn how to optimize production processes, manage work-in-process effectively, and implement Theory of Constraints (TOC) for continuous improvement in manufacturing plants. Discover strategies to reduce delays, enhance workflow, and increase operational efficiency.

Streamlining Operations for Efficiency Improvement in Manufacturing Plants
E N D
Presentation Transcript
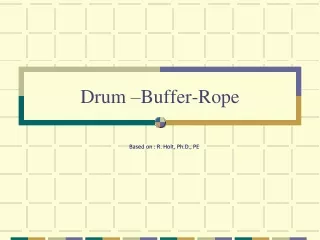
Drum –Buffer-Rope Based on : R. Holt, Ph.D., PE
Too Much Overtime Excellent Efficiency--Near 100% Chronic Complainer We Measure Operational Efficiency • Work flows from left to right through processes with capacity shown. MarketRequest11 Process A B C D E FG RM Capability (Throughput Rate) Parts/Day 7 9 5 8 6 RM = raw material FG = finished goods
Both found ways to look busy and appear to have a capacity of 5 parts/day. Reward Based on Efficiency • Work flows from left to right. Process A B C D E FG RM Capability(Throughput Rate) Parts/Day 7 9 5 8 6
In reality... • Processes A and B won’t produce more than Process C for long. Process A B C D E FG RM Potential P/D 7 9 5 8 6 Reality 5 5 5 5 5 P/D=parts/day
Then Variability Sets In • Processing times are just AVERAGE Estimates Process A B C D E 7 9 5 8 6 FG RM Reality 5±2 5±2 5±2 5±2 5±2
0.25 Two at a time: 0.25 Over all: 0,5*0,5*0,5*0,5*0,5=0,03125=3% Chance of 5 per day!!! What’s an Average? 50% • Half the time there are 5 or more per day at each process--Half the time less Process A B C D E 7 9 5 8 6 FG RM Reality 5±2 5±2 5±2 5±2 5±2 Probability 0.5 0.5 0.5 0.5 0.5
Previous Solution: Inventory • Put a day of inventory (WIP) at each process! WIP 5 5 5 5 5 Total 25 Process A B C D E 7 9 5 8 6 FG RM Variable 5±2 5±2 5±2 5±2 5±2 Process
Process A B C D E WIP 3 0 10 8 4 Total 25 FG RM System Variability Takes Over--Chaos Inventory (WIP) quickly shifts position. Inventory managertries to smooth it out. Distribution problems result. Costs go up !!! 7 9 5 8 6 Variable 5±2 5±2 5±2 5±2 5±2 Process
System Variability Takes Over--Chaos An Average of 5 means sometimes 3 and some times 7 Process A B C D E WIP 3 0 10 8 4 Total 25 7 9 5 8 6 FG RM Variable 5±2 5±2 5±2 5±2 5±2 Process Shifting work-in-process creates large queues at somelocations. This makes work wait longer to be processed. (based on Little´s law)
System Variability Takes Over--Chaos Process A B C D E WIP 3 0 10 8 4 Total 25 7 9 5 8 6 RM FG Variable 5±2 5±2 5±2 5±2 5±2 Process Shifting work-in-process creates large queues at somelocations. This makes work wait longer to be processed. Other workstations are starving for work (B) The work theycould do is delayed because they have no input material. They can’t take advantage of their extra capability. So....... ?
System Variability Takes Over--Chaos Process A B C D E ->X 30 WIP 3 5 10 8 4 Total 25 7 9 5 8 6 FG RM Variable 5±2 5±2 5±2 5±2 5±2 Process So… Management Helps! Management puts in more work (Inventory) (rate of input RM) to give everyone something to do (Cost world)! Result: It takes longer and longer from time of release until final shipping. More and more delay!!!!!!!!!!!
TOC Steps to Continuous Improvement Step 1. Identify the system’s constraint. Step 2. Exploitthe system’s constraint. Step 3. Subordinate everything else to the above decision. Step 4. Elevate the system’s constraint. Step 5. If a constraint is broken (that is, relieved or improved), go back to Step 1. But don’t allow inertia to become a constraint.
12 12 Step 1. Identify the Constraint (The Drum)- CRT Step 2. Exploit the Constraint (Buffer the Drum) – time reserve Step 3. Subordinate Everything Else (Rope) - feedback Step 4. Elevate the Constraint ($?) Five Steps Applied to Flow Operations WIP Total A B C D E RM FG 7 9 5 8 6 Five Focusing Steps Step 5. If the Constraint Moves, Start Over
FG Understanding Buffers WIP Total 12parts/5parts per day=2.5 Days A B C D E RM 7 9 5 8 6 • The “Buffer” is Time! • In general, the buffer is the total time from work release until the work arrives at the constraint. • Contents of the buffer alters (seebelow) • If different items spend different time at the constraint, then number of items in the buffer changes • but Time in the buffer remains constant.
Raw Material Buffer Finished Goods Buffer There is variability in the Constraint. To protect our delivery to our customer we need a finished goods buffer. There is variability in our suppliers.We need to protect ourselves from unreliable delivery. We need more than one Buffer A B C D E FG RM 7 9 5 8 6
Buffer Time is Constant-Predictable 12 Raw Material Buffer Finished Goods Buffer A B C D E FG RM 7 9 5 8 6 Raw Material Buffer 2 Days=10/5 Constraint Buffer2.5 Days Finished Goods Buffer1 Day Processing Lead Time is Constant
FG Buffer Management Constraint Buffer WIP Total 12/5=2.5 Days WO = Work Order A B C D E RM 7 9 5 8 6 WO21 WO17 WO13 • The Constraint is scheduled very carefully • Buffer Managed by location • Individual activities in the buffer are not scheduled WO12 WO16 WO20 WO19 WO15 WO11 WO18 WO14 WO10 2.5 Days 0 Time until Scheduled at Constraint
RM FG Constraint schedule is in jeopardy! (Red Zone Hole) Watch WO14 (Yellow) WO19 OK (Green) Problem Identification A B C D E RM 7 9 5 8 6 WO19DelayedParts WO21 WO17 WO13 WO20 WO12 WO16 WO19 WO11 WO15 WO14 WO18 WO10 2.5 Days 0 Time until Scheduled at Constraint
Additional Buffers • Constraint Buffer (as we discussed) • Protects the Constraint from running out of work • Finished Goods Buffer • Protects customer delivery from Constraint variation • Raw Material Buffer • Protects the Release of material from suppliers • Assembly Buffer • Facilitates speedy flow of products