Download
1 / 31
310 likes | 474 Views
Dr. Cleveland, This file contents 4 tracks poster slides. The format may not be same since we need to convert the slides into the poster template format. All the fonts for text are small which should become large after we convert. 14/03/2006 Hui, Jianying and Lei. The next slides are for track A.

E N D
Dr. Cleveland,This file contents 4 tracks poster slides. The format may not be same since we need to convert the slides into the poster template format. All the fonts for text are small which should become large after we convert.14/03/2006Hui, Jianying and Lei
Track A has each nurse record all documentation activities-the beginning time, the ending time, and the category of each documentation activity. Goal Characterize the distribution of all documentation activities for each unit. Methodology • An algorithm was developed to assign shift numbers to each nurse. • Visualization tools were developed to: • Study activity variabilities across units, nurses, shifts and time. • Identify the distribution class for the duration of each documentation activity. • Show the dependency between the category and duration of the activity. • Bayesian model will be built.
Preliminary Result • ”Meds Paperwork”, ”Assessment”, ”Other” are the most frequent documentation activities , which also have the largest variations among all units. Other 5 documentation activities are relatively less frequent with smaller variations. • Durations for different documentation activities follow log-normal distributions with activity depedent parameters. • There is "time of day" effect, but no ”day of week” effect on durations. Future Work Bayesian model will provide estimates of the activity probabilities and the parameters for marginal distributions of durations, and the overall posterior distributions derived from the Bayesian model will provide information about the uncertainty of the estimates.
Track B has each nurse carry a PDA that vibrates randomly during the day. When the PDA vibrates, the nurse enters the location and the activity category in the PDA. Goal Characterize activities for each unit – distributions of 76 activities and how they relate to the unit environmental variables. Methodology • Visualization tools were developed to Study: • Activity variabilities across units, nurses,shifts, and time. • Determine the form of the model • Model checking • Bayesian model with hierarchical priors will be built.
Preliminary Result • Nurses will work in the Nurse Station and Patient Room at most of the time, and then on the unit ,off the unit. • Direct Care ,In-Direct Care and Documentation are the most significant activity groups compared to Personal ,Other ,Waste, and Administrative. • 60% of the nurses' activities are value added, 17% are non-value added, 23% are necessary. Future Work The Bayesian model will provide estimates of the activity probabilities and the overall posterior distribution derived from the Bayesian model will provide information about the uncertainty of the estimates.
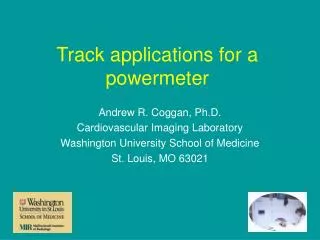
Track C uses Indoor Positioning System (IPS) to collect nurse motion data. Nurses carry four tracking tags (RFID) that report their locations and timestamps regularly. • Goal • Learn how nurses spend their time at different locations, such as the nurse station and the patient room. • Learn how nurses travel, such as heavily traveled paths and transition probabilities. • Characterize nurse motion and the total distance traveled and relate them to unit environmental variables such as the architectural layout.
Methodology • An algorithm was developed to determine the location and stay-time of a nurse by combining reports of the four RFID tags. • Visualization tools (trellis display) were developed to display the large volume of spatial data (Fig. 1) and to assist data exploration. • Animation tools were applied to show the movement of a nurse. • Preliminary Result • Nurses spend most of their time (40-60%) at the nurse station and the patient room (17-37%) (Fig. 2). • Nurse stations and their surrounding area are most frequently traveled. • Future Work • Statistical models will be built to characterize the nurse motion and the total travel distance, taking into account the unit environmental variables.
Figure 2: Time Percentage at Each Type of Location (14 Units)
Figure 3: Layout of Receivers and Directional Travel Frequencies
Figure 3. Node: green-hallway receivers; blue-nurse stations; pink- patient rooms and other. Edge: the path from one node to another. Numbers on edges: one-step travel frequencies.
Track Dhas volunteer nurses wear Bodymedia Armband to measure the physiological Responses of nurses, such as energy expenditure, steps, heart rate etc. • Goal • Evaluate and compare nurses’ physiological variables on/off the shift • Compare nurses’ physiologic variables across hospitals . • Methodology • Created plots for visualizing data and based on the plots, built statistical model
Track D-----Plots and Results Raw Data Plot ----- The plot presents each individual observation which is a good summary of the data and very helpful for checking during the whole analysis procedure. ----- The x variable is time of day (per minute) and the y variable is each measurements read by Bodymedia Armband minute by minute. ----- It is easy to catch shift information from this plot. Sample Plot : Figure1----Energy Expenditure Per Minute (kcal/min)
Figure 1 Energy Expenditure Per Minute (kcal/min)
Variables Shift Level Distribution ----- Presents 3 key physiologic variables shift level distribution information. The 3 variables are Total Energy Expenditure, Total Travel Distance and Average Heart Rate. ----- For the purpose of comparison, we normalize the length of total time to be 8 hours since it is the most frequent shift length and use the sleep data to be baseline to adjust each variable. Plot (Fig. 2) comments: ----- All 3 variables’ distribution look similar, they all have long tail on the right, and most of the values fall between the minimum and median. ----- The Total Travel Distance for a 8-hours nurse shift varies from 0 km to 8km. The median value is about 3.7 km. ----- The Total Energy Expenditure for a 8-hours nurse shift varies from 500 kcal to 2000 kcal. The median value is about 900 kcal. ----- The Average Heart Rate Per Minute for a 8-hours nurse shift varies from 72 to 95. The median value is about 77.
Variables Shift Level Distribution Conditional on Hospitals ----- Presents 3 key physiologic variables shift level distribution information conditional on units. -----Each panel represents a hospital, we ordered the panels by the median of values in each panel (red line). ----- From this type of plots, we can compare the variables’ distribution across hospitals. Sample Plot : Figure3----Total Travel Distance by Unit Plot Comments: ----Total Travel Distance in 8-hours shift for each unit does make difference, Some hospital the median is up to 4.2km, some is down to 3km.
Variables Nurse Level Distribution On/Off Shift Compare ----- Presents physiologic variables nurse level distribution On/Off shift compare information. The variables for comparison are Steps/min, Energy Expenditure/min, Heart Rate/min and the percentage of still time. ----- For the first 3 variables, we divided the whole observation for each nurse into 3 parts: Low value part, Middle value part and High value part. Sample Plot: Figure4-----Comparison of Heart Rate/min Sample Plot: Figure5-----Comparison of percentage of still time Plot Comments: ---- For both the low value part and Middle value part, on shift win off shift on average, for high value part, off shift wins on shift on average. The reason might due to the intensive physical exercise off shift. ----The Heart Rate for some nurse on shift can be very high, up t0 110 per minute which indicate some nurse workload and stress is big. ---- The percentage of still time off shift wins on shift a lot which indicates the nurse motion intensity on shift is much bigger than off shift.
Ask for suggestion:1. we feel our text about collect method, goals and methodology are repeating which may cause boring and make the space full of text, so we want to have a table before all the results part for 4 tracks instead of using 4 separate parts. The table is in the next slide. What do you think?2. Do we need to put the explanation of plot beside the plot?Send us back the comments and suggestions for modification. Thanks.