
Introduction
Introduction. Persistence and linkages between SSH/heat content and Q turb in the Gulf Stream: lagged correlations . Predictions from turbulent fluxes: differences in summer .

Introduction
E N D
Presentation Transcript
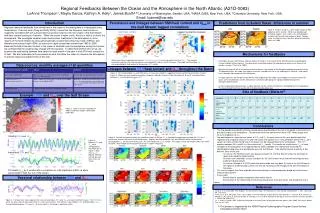
Introduction Persistence and linkages between SSH/heat content and Qturbin the Gulf Stream: lagged correlations Predictions from turbulent fluxes: differences in summer Regional seasonal feedbacks from stored heat in the ocean to the atmosphere is investigated using observations. Previous work (Dong and Kelly, 2004)) shows that low frequency heat content is negatively correlated with net surface heat flux (positive heat flux into the ocean) inthe Gulf Stream with heat content leading by 4 months. When the ocean is warm (cold), the flux is heat is to (from) the atmosphere. We investigate whether ocean heat content feedbacks to the atmosphere in other regions of the North Atlantic by using observationally constrained surface flux fields (OAFlux) and altimetry sea surface height (SSH) as a proxy for upper ocean heat content from 1993 to 2009. Because the bulk of the heat content in the ocean is shielded from the atmosphere during the summer, we surmised that the coupling may change with the seasons. To determine whether this is true, we examine the relationship between time series for each month of the year in both SSH and surface flux of heat. We also speculate on the processes at work that allow the ocean to influence the atmosphere in specific regions as specific times of the year. Figure 6. Analysis using Qturb gives larger regions of high predictive skill in summer. White lines indicate high correlation regions. Also shown is the climatological sensible heat flux with zero contour in black. Regions where sensible heat flux is positive, planetary boundary layers are stable SSH/Heat content autocorrelation Qturb autocorrelation Lagged correlations between SSH and Qturb SSH Qturb SSH Qturb Qturb Qturb SSH • December, January, and February heat flux (points A, B and L) in the vicinity of the Gulf Stream can be predicted by summer through fall heat content. The deep winter mixed-layer allows the atmosphere to access heat stored in the previous seasons(Timlin et al, 2002). • May heat flux (point E) off of the Northwest coast of Africa is the location of the Benguala upwelling that peaks in May. The boundary layers are stable (see regions of positive sensible heat flux in July and August in Figure 6.), and stored heat is brought into contact with the atmosphere. • In August (point H), the Florida Current delivers heat originating in the tropics to the region of the ocean off the East Coast of the United States and the atmosphere is relatively quiet giving rise significant deep heating of the atmosphere by the ocean. • In July, the planetary boundary layer is stable (point G) and the surface atmosphere is decoupled from the troposphere. The ocean forced heat fluxes can be felt in the planetary boundary layer. White areas have insignificant correlations. SSH/Heat content is much more persistent than Qturb. The negative correlation indicates that a warmer ocean is correlated with heat flux out of the ocean. November and December Qturbcan be predicted by heat content in the previous 4-11 months. Data sources: monthly averages of all quantities Regional Feedbacks Between the Ocean and the Atmosphere in the North Atlantic (A21D-0083)LuAnne Thompson1, Maylis Garcia, Kathryn A. Kelly1, James Booth2,31University of Washington, Seattle, USA, 2NASA GISS, New York, USA, 3Columbia University, New York, USA, Email: luanne@uw.edu Linkages between SSH/heat content and Qnetthroughout the Basin Figure 4. We smoothed bothQnetand SSH with a 3o Gaussian smoother. Lagged correlations performed at locations shown in Figure 5. Shown are only negative correlations for points labeled in Figure 6. Note that regions A, B and C show correlations between Qnetand the previous years SSH. Size of feedback (Watts/m2) Example: SSH and Qnetover the Gulf Stream SSH Figure 1. SSH (in cm) on December 27, 1995. Gulf Stream region is defined by yellow box. Conclusions • The two-decade long satellite altimeter record allows quantification of the role of variability in heat content in driving changes in the atmosphere. The persistence of heat content over that of SST allows longer lead times for prediction of Qnet. • Lag correlations of separate time series of SSH and Qnetfor each month of the year demonstrate that regionally and at specific times of the year the ocean heat content (SSH) has predictive skill for the Qnetfor a season or more and the stored heat in the ocean can be released back to the atmosphere. The SSH explains between 20% and 40% of the variance of Qnetlocally. The results are similar when Qturbis used. • Linkages to the atmosphere are suggested by the work of Minobe et al (2010) who examined the climatological cloud cover and precipitation over the Gulf Stream. They identify two loci of activity at two different times of the year: • In summer, the Florida Current (see August and point H), the Gulf Stream forces the formation of upper level clouds by deep heating. • In winter (see December, January and point A), the Gulf Stream forces low level convergence that leads to mid-level clouds. In summer, Minobeet al (2010) show low level clouds (see July point G) north of the Gulf Stream in the region of stable boundary layers, but they do not discuss the linkages of the low level clouds to the ocean. • Our results suggest that there might be interannual changes in cloud properties forced by surface fluxes linked to heat content. • Future work: • Examination of seasonal coupling in other ocean basins • Examination of the relationship of interannual cloud cover to surface fluxes and stored heat in the ocean. • Examination of the relationships discussed here in coupled climate models Qnet Monthly SSH and -Qturb Figure 5. We look for locations where for a particular month of the year Qneis significantly negatively correlated with SSH for 4 consecutive months (the bands in the above figure). Regions with high predictive skill are outlined in white and overlie the climatological Qnetfor that month of the year. The zero contour for Qnetis in black. The regions of high correlations differ from month to month. Also marked are the locations for analysis shown in Figure 4. Figure 2. Monthly SSH and Qturbwereaveraged over the yellow box in Figure 1. Note that -Qturb is plotted. Monthly and low passed time series are shown. SSH (m) -Qturb(Watt m-2) B InterannualSSH and -Qturb C D A SSH leads Qturb by 5 months with a correlation of -0.53 significant at 95% (a warm ocean leads to heat flux out of the ocean). G H Seasonal relationship between SSH and Qturb E F -Qturb(Watt m-2) SSH (m) L K I J Figure 3. The blue lines show separate time series of anomalous SSH and –Qturb, for each month of the year. The SSH times series are very similar to each other while Qturbtime series are not. The red lines show October SSH, and November –Qturb. The correlation between SSH and Qturbfor these month is -0.43 and is significant at 95%. Mechanisms for feedbacks References Dong, S., K. A. Kelly, 2004: Heat Budget in the Gulf Stream Region: The Importance of Heat Storage and Advection. J. Phys. Oceanogr., 34, 1214–1231. Timlin, M. S., M. A. Alexander, and C. Deser, 2002: On the reemergence of North Atlantic SST anomalies. J. Climate, 15, 9, 2707-2712. Minobe, S., Masato M., A. Kuwano-Yoshida, H. Tokinaga, S.-P. Xie, 2010: Atmospheric Response to the Gulf Stream: Seasonal Variations. J. Climate, 23, 3699–3719. Yu, L., and R. A. Weller, 2007: Objectively Analyzed air-sea heat Fluxes for the global oce-free oceans (1981–2005). Bull. Ameri. Meteor. Soc., 88, 527–539. • This project is supported by the NASA Physical Oceanography Program Ocean Surface Topography Science Team


