Download
1 / 46
460 likes | 677 Views
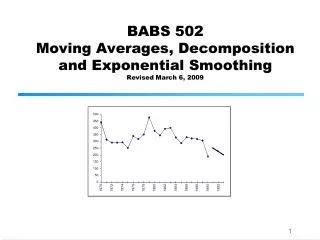
BABS 502. Lecture 1 Feb 21, 2011. Bookkeeping. Your instructor Course guidelines Lectures Assignments Project – no exam Contest Software –NCSS. What is a Forecast?. A prediction of the future fore = before + cast = throw Literally planning before you throw.

E N D
BABS 502 Lecture 1 Feb 21, 2011 (C) Martin L. Puterman
Bookkeeping • Your instructor • Course guidelines • Lectures • Assignments • Project – no exam • Contest • Software –NCSS (C) Martin L. Puterman
What is a Forecast? A prediction of the futurefore = before + cast = throwLiterally planning before you throw. There is some confusion about this point Often organizations refer to direct outputs of decisions as forecasts. (Sometimes it is easier to use this terminology) Example – “production forecasts” are not “forecasts” They are subject to variability but are known to some degree of accuracy by organization members. (C) Martin L. Puterman
Course Themes • Forecasts are necessary for effective decision making • Forecasting, planning and control are interrelated • Forecasts are usually (almost always) wrong • Quantifying forecast variability is as important as determining the forecast; it is the basis for decision making. • Rare events happen and can have significant impact on forecasts • Scientific methods improve forecasting (C) Martin L. Puterman
Course Objectives • To provide a structured and objective approach to forecasting • To provide hands on experience with several popular forecasting methods and statistical software • To determine the data requirements for effective forecasting • To integrate forecasting with management decision making and planning • To introduce you to some advanced forecasting methods (C) Martin L. Puterman
Why Forecast? • It’s fun • To look smart • But most importantly: To make better decisions • Investments • Inventory • Staffing levels • Medical treatment timing • Fact repeated: Forecasts are usually (always?) wrong! • Why do it then? • Because you have to!! • Effect of bad forecasts • Excess costs – too much staff or stock • Poor service –waiting lines and stockouts (C) Martin L. Puterman
Knowledge Base for Effective Forecasting • Subject Matter Knowledge • Industry • Market • Demand Sources • Statistics • Statistical software and IT • Interpersonal skills • acquiring data • Working with IT department • report writing • presentations • team work (C) Martin L. Puterman
Forecasting Applications • Demand forecasts • Whistler-Blackcomb - staffing • TELUS – capacity expansion • Worksafe BC – staffing, budgeting and reserve planning • Health Authorities – staffing, scheduling and planning • Mike’s Products - production and inventory decisions • Price forecasts • Teck- Cominco - production planning, ore purchase • Vancouver Olympic Village – resale value • New market forecasts; • Webvan, Petfood.com, Napster • Technology forecasts • Intel; Nortel; TELUS; Microsoft; Google (C) Martin L. Puterman
Forecasting Demand by SKUfor a Consumer Product Distribution System (C) Martin L. Puterman
The Challenge • Enhance the performance of the inventory and distribution system for products in the US market • Highly competitive market with highly seasonal demand patterns • Client’s Goal - Get the right product in the right quantity to the right customer on time! (C) Martin L. Puterman
The Production/Distribution System Co-packers Products Distribution Centers Retailers (many) (C) Martin L. Puterman
Modeling • A linear programming based planning tool • For each SKU it finds for the next 12 months: • Optimal co-packer production levels • Optimal distribution and transshipment plans • Optimal distribution center (DC) inventory levels • Developed for operational decisions but first used for tactical/strategic decisions • Implemented in Excel using Frontline Solver • User friendly interface (C) Martin L. Puterman
Using the Model in Practice (C) Martin L. Puterman
Forecasts drive the model! • Key input – Forecasts by sales region by SKU for next 12 months. • Produced by regional sales representatives • Accuracy declines over 12 month period • Not calibrated but good in aggregate! • But model is used in a rolling horizon approach (C) Martin L. Puterman
Company logo (C) Martin L. Puterman
Model in MS Excel (C) Martin L. Puterman
More on Forecasting (C) Martin L. Puterman
Forecasting is NOT a Statistical Topic • Primary interest is not in hypothesis tests or confidence intervals. • Underlying statistical models are often used: • regression • time series • neural networks • dynamic Bayesian systems and state space models • Forecasts must be assessed on • the quality of the decisions that are produced • their accuracy (C) Martin L. Puterman
Types of Forecasting • Extrapolation • Based on previous data patterns • Assumes past patterns hold in future • Exponential Smoothing, Trend Models, ARIMA models • Causal • Based on factors that might influence the quantity being forecasted • Assumes past relationships hold in the future • Regression • Judgemental • Based on individual knowledge • Sales force composites, expert opinion, consensus methods • Surveys and market research • Collaborative • Based on information available to supply chain partners • Information sharing and partnerships (C) Martin L. Puterman
Forecasting Considerations • Forecasts vs. Targets • Short Term vs. Medium Term vs. Long term • Operational or Strategic Decision Making • One Series vs. Many • Seasonal vs. Non-seasonal • Simple vs. Advanced • One-Step Ahead vs. Many Steps Ahead • Automatic vs. Manual • Exceptions • When to update models (C) Martin L. Puterman
Forecasting Horizons • Short term • a few days or weeks • Medium term • usually a few months to 1 or 2 years • Long term • usually more than 2 year • Why distinguish between these? • Different methods are more suitable in each case. • Different applications require different forecasts. (C) Martin L. Puterman
Some Forecasting Observations He who lives by the crystal ball soon learns to eat ground glass. • Edgar R. Fiedler in The Three Rs of Economic Forecasting-Irrational, Irrelevant and Irreverent , June 1977. Prediction is very difficult, especially if it's about the future. • Nils Bohr, Nobel laureate in Physics • This quote serves as a warning of the importance of testing a forecasting model out-of-sample. It's often easy to find a model that fits the past data well--perhaps too well!--but quite another matter to find a model that correctly identifies those features of the past data which will bereplicated in the future There is no reason anyone would want a computer in their home. • President, Chairman and founder of Digital Equipment Corp, 1977 640K ought to be enough for anybody. • Bill Gates, 1981 Our sales forecasts are accurate in aggregate • Many marketing directors (C) Martin L. Puterman
Forecasting methods that work • Naïve: Last Period or Same Period Last Year • Regression • Extrapolation • Causal • Exponential Smoothing • Simple • Trend / Damped Trend • Holt-Winters • Pooled methods (C) Martin L. Puterman
Forecasting methods I don’t recommend • Crystal balls • Tea leaves • Fortune cookies • Expert Opinion • Complex statistical models • Box-Jenkins / ARIMA Models • Multivariate Econometric Models • Neural Networks (C) Martin L. Puterman
Forecasting in Organizations There is no forecasting department! (C) Martin L. Puterman
Forecasting Practice in Organizations • Surveys have addressed the following questions: • What quantities do organizations need to forecast? • What methods are users familiar with? • What methods have been used? • What are the impediments to using quantitative techniques? • What factors which make forecasting most difficult? • Bottom Line – Formal forecasting is not widely used because of the lack of data or knowledge. (C) Martin L. Puterman
What do organizations need to forecast? • Costs • raw materials • wage rates and overheads • interest rates • exchange rates • Sales or demand • by region • by SKU • by time of day • for new and existing products • competitive behaviour • Defect rates (C) Martin L. Puterman
What do organizations need to forecast? • Technology • new products • new processes • diffusion rates • Social and Political trends • demographics • wealth profile • welfare and health provisions • impact of technology • Projects • duration • costs • life cycle needs (C) Martin L. Puterman
Top 10 impediments to effective forecasting 10. Absence of a forecasting function 9. Poor data 8. Lack of software 7. Lack of technical knowledge 6. Poor data 5. Lack of trust in forecasts 4. Poor data 3. Too little time 2. Not viewed as important 1. Poor data (C) Martin L. Puterman
Forecasting Challenges • Technical Issues • What is the best approach • Organizational Issues • reporting structures • accountability • incentive systems • Information • historical data not available • timeliness and reliability • what information is required when • Users • conflicting objectives (C) Martin L. Puterman
Silos and Forecasting Marketing Production Forecaster IT (C) Martin L. Puterman
Scientific Forecasting (C) Martin L. Puterman
Scientific Forecasting • Requires familiarity with very basic statistical concepts: • Mean, standard deviation, skewness and kurtosis • medians and percentiles • histograms, stem and leaf plots, box plots • scatter plots, correlation, regression If you’re not keeping score, you are only practicing! (C) Martin L. Puterman
The Forecasting Process - I • Determine what is to be forecasted and at what frequency • Obtain data • Process the data • PLOT THE DATA • Clean the data • Hold out some data (C) Martin L. Puterman
The Forecasting Process - II • Obtain candidate forecasts • Assess their quality • Forecast accuracy on hold out data • Do they make sense? • Do they produce good decisions? • Revise forecasts • Recalibrate model on full data set • Produce forecasts and adjust as necessary • Produce report • In future - Evaluate accuracy of forecasts (C) Martin L. Puterman
Means and Standard Deviations • Means and standard deviations are only useful for summarizing data when it looks like it comes from a normal distribution They especially are not appropriate for summarizing time series data with trends or seasonality. (C) Martin L. Puterman
Some Normal Distribution Properties • Determined completely by its mean and standard deviation • Its skewness is 0 and its kurtosis is 0 • 95% of the observations fall within 2 standard deviations (not standard errors!) of the mean • Useful for determining forecast ranges • Usually forecasts are accurate to 2 standard deviations • 95% of the observations fall below • + 1.645 • Useful for determining service levels of inventory policies • When extreme outliers may occur, the normal distribution may not be appropriate • Such distributions are said to have long tails • These distributions have positive kurtosis. • The book, The Black Swan, by NassimTaleb addresses the practical significance of this issue. (C) Martin L. Puterman
Data Patterns (C) Martin L. Puterman
Basic Modeling Concept An observed measurement is made up of a systematic part and a random part Unfortunately we cannot observe either of these. Forecasting methods try to isolate the systematic part. Forecasts are based on the systematic part. The random part determines the distribution shape and forecast accuracy. (C) Martin L. Puterman
Basic Concept Again Observed Value = Signal “+” Noise In non-normal (or non-additive) models the “+” may be inappropriate (C) Martin L. Puterman
Forecasting Notation (p.71) t a specific time period n total number of observations Yt observed value at time t Ft+k forecasted value k periods ahead at time t (C) Martin L. Puterman
Correlation • Measures the strength of the (linear) relationship between two measurements • Often denoted by rXY • A number between -1 and +1 • Answers question: Does one measurement contain information about another measurement? • Theoretically rXY = Cov(X,Y)/X Y • From a sample rXY (see equation 2.8). (C) Martin L. Puterman
Autocorrelation - What is it? • Correlation between observations at different time points in a time series - estimated by rk • Lag 1 autocorrelation measures the correlation between Yt and Yt-1 • Lag k autocorrelation measures the correlation between Yt and Yt-k • Summarized in terms of an autocorrelation function (ACF) which give the autocorrelations between observations at all lags. • It is often represented graphically as a plot of autocorrelation vs. lag (C) Martin L. Puterman
Autocorrelation - Why is it useful? • Can the past help predict the future? • if autocorrelations at all lags are near zero then best predictor is historical mean • if all autocorrelations of differences of series are near zero then best predictor of the future is the current value • if autocorrelations at seasonal lags are large - suggests seasonality in data • An important component of the ARIMA or Box-Jenkins’ method (C) Martin L. Puterman
Autocorrelation Example 1 (C) Martin L. Puterman
Autocorrelation Example 2 Original Difference (C) Martin L. Puterman