Download
1 / 16
180 likes | 330 Views
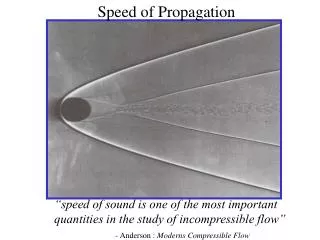
Propagation of Error. Analysis of Data. Simplest Case. Consider some measurement of a parameter, x , that leads to the computation of a result, z : z = f ( x ) A measured value, say x o , leads to the calculation of z o .

E N D
Propagation of Error Analysis of Data
Simplest Case Consider some measurement of a parameter, x, that leads to the computation of a result, z : z = f (x) A measured value, say xo, leads to the calculation of zo. The measured value has a range of error of xo± δx and this means there is also a corresponding range in the computed value, zo ± δz. The value of δz is what must be determined. This means a relation between δx andδz must be found.
Simple Example Consider a simple parabolic relation: z = x2 The ranges of error can be introduced directly: zo ± δz = (xo ± δx)2 And expanding gives: zo ± δz = xo2 ± 2xoδx + (δx)2 where the last term usually can be neglected since it should be small compared to xo. Since zo = xo2, then δz = 2xoδx. The relative uncertainty then is: δz/zo = 2xoδx/ xo2 = 2δx/ xo
General Approach The finite differences are simply expressions of the derivative: dz/dx Thus: dz/dx = f '(x) So: δz = f '(x) δx This is more useful and simplifies cases where the elementary finite difference approach produces a great deal of algebraic complexity.
Example Consider the relation: With relative error:
Extension to Two Variables Examine if the method can be extended: z = xy Thus, This gives: With relative uncertainty:
This can be generalized to show the method: Consider z = xayb Or ln z = a ln x + b ln y Differentiating implicity gives: Giving relative uncertainty:
Standard Deviation of Computed Values Examine a computed value that is a function of two variables: z = f (x,y) which leads to the general expresssion: Now, the standard deviation is:
Substituting appropriately: So then the variance is And using the general definition of the standard deviation and the fact that the cross term of the differentials (last term) is negligible gives:
For a small data set, say N < 10, the standard error is better expressed as: Or for the variance:
Multivariable Propagation of Error Thus, in general, a calculated value that depends on many different variables with form: z = f (x1, x2 … xn) will have a standard deviation of: Or more simply:
Example The inherent viscosity, ηinh, is defined as: Where c is the per cent concentration t: the time of flow of a specified volume of solution through a capillary to:the time of flow of that same volume of solvent through the same capillary.
Applying the general expression for the computation of the variance of the computed quantity gives: Because it can be measured to much higher accuracy and precision than the times, the concentration is assumed to be error-free ( not usually a justifiable assumption) and is treated as a constant. Were this not the case, then the numerator of the concentration term would be the variance of the concentration.
The values determined from the data are used in the expression derived by the propagation of error analysis: The variance of the concentration is negligible compared to the error in the time measurements, so sc2 ~ 0. Thus Sinh = 3.14 x 10⁻³