Download
1 / 11
110 likes | 241 Views
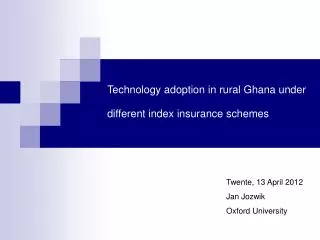
Technology adoption in rural Ghana under different index insurance schemes. Twente, 13 April 2012 Jan Jozwik Oxford University. Context. Yield-improving technologies can solve rural poverty traps Low adoption of new technologies in LDCs (often around 40%) Potential reasons:

E N D
Technology adoption in rural Ghana under different index insurance schemes Twente, 13 April 2012 Jan Jozwik Oxford University
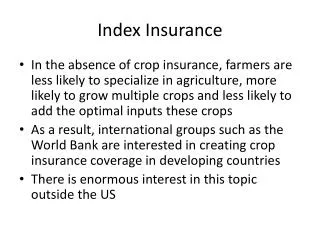
Context • Yield-improving technologies can solve rural poverty traps • Low adoption of new technologies in LDCs (often around 40%) Potential reasons: • Learning (Foster & Rozenzweig, 1995) • Risk preferences (Zilberman, 1983) • Imperfect credit/insurance markets (Hoff, Braverman, Stiglitz, 1993) • Behavioral: time-inconsistency (Duflo, Kremer & Robinson, 2009) • Low levels of continued adoption of new technologies • i.e. over 30% Kenyan maize farmers switch across seasons (Suri, 2012) • Uninsured risk of very low consumption • Dercon & Christiaensen (2011) argue that Ethiopian farmers prefer not to adopt high-mean technology giving very low returns in bad years • Adding insurance to technology package provided on credit may lower demand if farmer borrow with implicit insurance (Gine & Yang, 2007)
Framed Field Experiment • Insurance could raise aggregate adoption • High-return adopters can pay premium • Low-return adopters get insurance and are able to adopt next season • Benefits of experiment • Controlling for other factors constraining adoption and insurance take-up • Technology with insurance understudied in framed field experiment: • 2 exceptions give mixed evidence : • Carter (2008): ‘60% of farmers purchased the insurance and chose the high return activity’ • Hill & Viceisza (forthcoming): ‘some evidence that insurance has a positive impact on insurance’ • these studies differ substantially in price and basis risk levels of insurance • Adoption decision may depend on insurance product
Cocoa farming in Ghana • World leading exporter but mostly traditional technology • Abrabopa: technology inputs on credit since 2007, 19000 members today • Key farming concern: tree destruction via Swollen Shoot Virus disease (Stutley,2010) • Cocoa Marketing Board offers limited compensation schemes • Sample-based index insurance (historical data)?
Objectives of the Experiment • 1.Elicitation of Risk Preferences • 2. Technology adoption decision in multiple-period setting under different insurance schemes • Can insurance encourage higher adoption of technologies? • Can insurance encourage sustained adoption of technologies? • Will the impact vary across different insurance products?
Framed Field Experiment • Subjects: cocoa farmers from Abrabopa • Framing: choosing between high-risk/low-risk technology affecting yields and income • 4 rounds • Fixed endowment – income evolves over rounds • Control: no insurance • Treatments: different types of index insurance which is offered only with high-risk technology • 20 subjects randomly allocated to a session (Control - 2 sessions, each Treatment - 2 sessions) • 25%: probability of bad weather
Randomisation Structure • Two-stage procedure (similar to Clarke, 2011) • Stage 1: wheel spun (weather) • 75% yellow bag (no virus in this district) • 25% red bag (virus in this distrct) • Stage 2: token drawn (yield) • yellow token: high yield, red token: low yield • 3 tokens in each bag • Yellow bag: 2 yellow tokens + 1 red token • Red bag: 1 yellow token + 2 red tokens • Basis risk = 75% * 33% = 25% This happens if index shows good weather but subject has low yields (yellow bag+red token)
Control • Dummy variable for adoption decision Ait • Ait =0 low-risk, low-variance traditional technology • Ait =1 high-risk high-variance modern technology • No insurance option for modern technology • Yield payoffs unknown yet – will be carefully calibrated from survey data
Treatments • Choosing low-risk technology – no insurance • Choosing high-risk technology – actuarially fair insurance • T1 partial coverage: insurance covers 50% losses but premium is low • T2 full coverage: insurance covers 100% losses but premium is high • T3 T1 + no basis risk • T4 T2 + no basis risk (insurance in Hill & Viceisza) Hence in yellow bag (good weather) there are: - 2yellow+1red tokens (25% basis risk) under T1 & T2 - 3yellow tokens (0% basis risk) under T3 & T4
Additional treatment options • Framing - Positive frame (insurance pays 1 out of 4 years+benefits of insuring) - Negative frame (insurance does not pay 3 out of 4 years+problems of not insuring) • Probability of bad weather - Virus occurs with 25% probability - Virus occurs with 10% probability • Insurance loading - Actuarially fair loading - 30% above actuarially fair - free • Basis risk - Basis risk is 25% - Basis risk is 10% - Basis risk is 0%
Key Empirical Specifications • Probit model for adoption decision Ait : Ait = β0 + β 1 T1it + β 2T2it + β 3T3it + β 4T4it + γXit + εit (Ait is dummy for adoption choice, Xit is vector of additional controls) • Probit model for continued adoption Yit : Yit = β0 + β 1 T1it + β 2T2it + β 3T3it + β 4T4it + γXit + εit (Y is dummy for continuing adoption from t onwards once Ait-1 =1