Download

1 / 13
130 likes | 460 Views
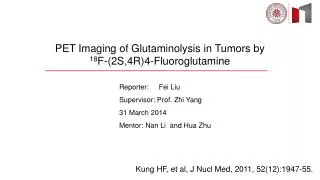
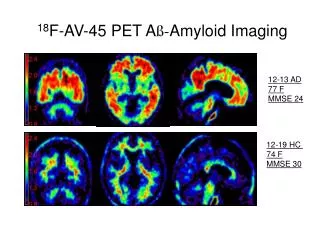
Pre- Tx T1+C. POSITRON EMISSION TOMOGRAPHY PARAMETRIC RESPONSE MAP (PET-PRM). IOIS: 3401. Pre- Tx 18 F-FDOPA PET. Post- Tx 18 F-FDOPA PET. Difference Post-Pre Tx 18 F-FDOPA PET. RESPONDER. Change in 18 F-FDOPA Signal. - Decrease. + Increase.

E N D
Pre-Tx T1+C POSITRON EMISSION TOMOGRAPHY PARAMETRIC RESPONSE MAP (PET-PRM) IOIS: 3401 Pre-Tx18F-FDOPA PET Post-Tx18F-FDOPA PET Difference Post-Pre Tx18F-FDOPA PET RESPONDER Change in 18F-FDOPA Signal - Decrease + Increase Benjamin M. Ellingson, Ph.D., Dept. of Radiological Sciences, David Geffen School of Medicine at UCLA, 2011
Pre-Tx T1+C POSITRON EMISSION TOMOGRAPHY PARAMETRIC RESPONSE MAP (PET-PRM) IOIS: 3401 Difference Post-Pre Tx18F-FDOPA PET Change in 18F-FDOPA Signal - Decrease + Increase Benjamin M. Ellingson, Ph.D., Dept. of Radiological Sciences, David Geffen School of Medicine at UCLA, 2011
Pre-Tx T1+C POSITRON EMISSION TOMOGRAPHY PARAMETRIC RESPONSE MAP (PET-PRM) IOIS: 2383 Pre-Tx18F-FDOPA PET Post-Tx18F-FDOPA PET Difference Post-Pre Tx18F-FDOPA PET NON-RESPONDER Change in 18F-FDOPA Signal - Decrease + Increase Benjamin M. Ellingson, Ph.D., Dept. of Radiological Sciences, David Geffen School of Medicine at UCLA, 2011
Pre-Tx T1+C POSITRON EMISSION TOMOGRAPHY PARAMETRIC RESPONSE MAP (PET-PRM) IOIS: 2383 Difference Post-Pre Tx18F-FDOPA PET NON-RESPONDER Change in 18F-FDOPA Signal - Decrease + Increase Benjamin M. Ellingson, Ph.D., Dept. of Radiological Sciences, David Geffen School of Medicine at UCLA, 2011
POSITRON EMISSION TOMOGRAPHY PARAMETRIC RESPONSE MAP (PET-PRM) RESPONDER Pre-Tx DOPA Tumor Volume = 117.5 mL DOPA PRM % Decreasing DOPA Uptake = 93.0% % Increasing DOPA Uptake = 7.0 % Change in 18F-FDOPA Signal - Decrease + Increase Pre-Tx DOPA Tumor Volume = 18.3 mL NON-RESPONDER DOPA PRM % Decreasing DOPA Uptake 72.8% % Increasing DOPA Uptake = 27.2 % Benjamin M. Ellingson, Ph.D., Dept. of Radiological Sciences, David Geffen School of Medicine at UCLA, 2011
POSITRON EMISSION TOMOGRAPHY PARAMETRIC RESPONSE MAP (PET-PRM) RESPONDER All Changes > 25% Change > 50% Change % Decreasing DOPA Uptake = 93.0% % Decreasing > 25% change = 47.9% % Decreasing > 50% change = 18.2% % Increasing DOPA Uptake = 7.0 % % Increasing > 25% change = 0.9% % Increasing > 50% change = 0.0% % Change in 18F-FDOPA Signal - 100% + 100% Benjamin M. Ellingson, Ph.D., Dept. of Radiological Sciences, David Geffen School of Medicine at UCLA, 2011
POSITRON EMISSION TOMOGRAPHY PARAMETRIC RESPONSE MAP (PET-PRM) NON-RESPONDER All Changes > 25% Change > 50% Change % Decreasing DOPA Uptake = 72.8% % Decreasing > 25% change = 31.9% % Decreasing > 50% change = 2.7% % Increasing DOPA Uptake = 27.2 % % Increasing > 25% change = 3.2% % Increasing > 50% change = 0.05% % Change in 18F-FDOPA Signal - 100% + 100% Benjamin M. Ellingson, Ph.D., Dept. of Radiological Sciences, David Geffen School of Medicine at UCLA, 2011
POSITRON EMISSION TOMOGRAPHY PARAMETRIC RESPONSE MAP (PET-PRM) % Decreasing DOPA % Increasing DOPA Benjamin M. Ellingson, Ph.D., Dept. of Radiological Sciences, David Geffen School of Medicine at UCLA, 2011
POSITRON EMISSION TOMOGRAPHY PARAMETRIC RESPONSE MAP (PET-PRM) RESPONDER VOLUME OF DECREASING DOPA UPTAKE = 175.5 mL VOLUME OF INCREASING DOPA UPTAKE = 0.8 mL NON-RESPONDER VOLUME OF DECREASING DOPA UPTAKE = 7.4 mL VOLUME OF INCREASING DOPA UPTAKE = 1.2 mL Change in 18F-FDOPA Signal - Decrease + Increase Benjamin M. Ellingson, Ph.D., Dept. of Radiological Sciences, David Geffen School of Medicine at UCLA, 2011
XXXX 18F-FDOPA PET Parametric Response Maps (PET PRMs) Change in PET Signal -5000 + 5000 Baseline: 3/10/09 10/20/09 3/30/10 10/12/10 2/15/11 Benjamin M. Ellingson, Ph.D., Dept. of Radiological Sciences, David Geffen School of Medicine at UCLA, 2011
XXXX 18F-FDOPA PET Parametric Response Maps (PET PRMs) Baseline: 3/10/09 Benjamin M. Ellingson, Ph.D., Dept. of Radiological Sciences, David Geffen School of Medicine at UCLA, 2011
Pre-Tx T1+C MALIGNANT MARKER MAPS (18F-FLT and 18F-FDOPA ) IOIS: 3401 Pre-Tx18F-FDOPA PET Pre-Tx18F-FLT PET Combined 18F-FLT and 18F-FDOPA FLT DOPA FLT+DOPA Benjamin M. Ellingson, Ph.D., Dept. of Radiological Sciences, David Geffen School of Medicine at UCLA, 2011
MALIGNANT MARKER MAPS (18F-FDOPA + CBV + ADC ) Benjamin M. Ellingson, Ph.D., Dept. of Radiological Sciences, David Geffen School of Medicine at UCLA, 2011


![PET Tracer Coordination [ F-18] labeled](https://cdn3.slideserve.com/6693342/slide1-dt.jpg)