Download
1 / 35
350 likes | 371 Views
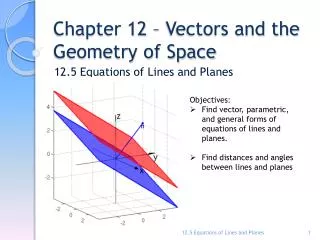
Explore functions of two variables. Learn about domains, ranges, and graphing techniques to visualize surfaces. Practice with examples and understand cross-sections.

E N D
Functions of Two Variables • The temperature T at a point on the surface of the earth at any given time depends on the longitude x and latitude y of the point. • We can think of T as being a function of the two variables x and y, or as a function of the pair (x, y). We indicate this functional dependence by writing T = f(x, y). • The volume V of a circular cylinder depends on its radius r and its height h. In fact, we know that V = r2h. We say thatV is a function of r and h, and we write V(r, h) = r2h.
Functions of Two Variables • We often write z = f(x, y) to make explicit the value taken on by f at the general point (x, y). The variables x and y are independent variables and z is the dependent variable. [Compare this with the notation y = f(x) for functions of a single variable.] • The domain is a subset of , the xy-plane. We can think of the domain as the set of all possible inputs and the range as the set of all possible outputs. • If a function f is given by a formula and no domain is specified, then the domain of f is understood to be the set of all pairs (x, y) for which the given expression is a well-defined real number.
Example 1 – Domain and Range • If f(x, y) = 4x2 + y2, then f(x, y) is defined for all possible ordered pairs of real numbers (x, y), so the domain is , the entire xy-plane. • The range of f is the set [0, ) of all nonnegative real numbers. [Notice that x2 0 and y2 0, so f(x, y) 0 for all x and y.]
Graphs • One way of visualizing the behavior of a function of two variables is to consider its graph. • Just as the graph of a function f of one variable is a curve C with equation y = f(x), so the graph of a function f of two variables is a surface S with equation z = f(x, y).
Graphs • We can visualize the graph S of f as lying directly above or below its domain D in the xy–plane (see Figure 3). Figure 3
Example 4 – Graphing a Linear Function • Sketch the graph of the function f(x, y) = 6 – 3x – 2y. • Solution: • The graph of f has the equation z = 6 – 3x – 2y, or 3x + 2y + z = 6, which represents a plane. • To graph the plane we first find the intercepts. • Putting y = z = 0 in the equation, we get x = 2 as the x-intercept. • Similarly, the y-intercept is 3 and the z-intercept is 6.
Example 4 – Solution cont’d • This helps us sketch the portion of the graph that lies in the first octant in Figure 4. Figure 4
Graphs • The function in Example 4 is a special case of the function • f(x, y) = ax + by + c • which is called a linear function. • The graph of such a function has the equation • z = ax + by + c or ax + by – z + c = 0 • so it is a plane.
Example 5 • Sketch the graph of the function f(x, y) = x2. • Solution: • Notice that, no matter what value we give y, the value of f(x, y) is always x2. • The equation of the graph is z = x2, which doesn’t involve y. • This means that any vertical plane with equation y = k (parallel to the xz-plane) intersects the graph in a curve with equation z = x2, that is, a parabola.
Example 5 – Solution cont’d • Figure 5 shows how the graph is formed by taking the parabola z = x2 in the xz-plane and moving it in the direction of the y-axis. • So the graph is a surface, called a parabolic cylinder, made up of infinitely many shifted copies of the same parabola. Figure 5 The graph of f(x, y) = x2 is the parabolic cylinder z = x2.
Graphs • In sketching the graphs of functions of two variables, it’s often useful to start by determining the shapes of cross-sections (slices) of the graph. • For example, if we keep x fixed by putting x = k (a constant) and letting y vary, the result is a function of one variable z = f(k, y), whose graph is the curve that results when we intersect the surface z = f(x, y) with the vertical plane x = k.
Graphs • In a similar fashion we can slice the surface with the vertical plane y = k and look at the curves z = f(x, k). • We can also slice with horizontal planes z = k. All three types of curves are called traces (or cross-sections) of the surface z = f(x, y).
Example 6 • Use traces to sketch the graph of the function f(x, y) = 4x2 + y2. • Solution: • The equation of the graph is z = 4x2 + y2. If we put x = 0, we get z = y2, so the yz-plane intersects the surface in a parabola. • If we put x = k (a constant), we get z = y2 + 4k2. This means that if we slice the graph with any plane parallel to the yz-plane, we obtain a parabola that opens upward.
Example 6 – Solution cont’d • Similarly, if y = k, the trace is z = 4x2 + k2, which is again aparabola that opens upward. If we put z = k, we get thehorizontal traces 4x2 + y2 = k, which we recognize as afamily of ellipses. • Knowing the shapes of the traces, we can sketch the graph of f in Figure 6. • Because of the elliptical and parabolic traces, the surface z = 4x2 + y2 is called an elliptic paraboloid. Figure 6 The graph of f(x, y) = 4x2 + y2 is the elliptic paraboloid z = 4x2 + y2. Horizontal traces are ellipses; vertical traces are parabolas.
Example 7 • Sketch the graph of f(x, y) = y2 – x2. • Solution: • The traces in the vertical planes x = k are the parabolas z = y2 – x2, which open upward. • The traces in y = k are the parabolas z = –x2 +k2, which open downward. • The horizontal traces are y2 – x2 = k, a family of hyperbolas.
Example 7 – Solution cont’d • We draw the families of traces in Figure 7. Figure 7 Vertical traces are parabolas; horizontal traces are hyperbolas. All traces are labeled with the value of k.
Example 7 – Solution cont’d • We show how the traces appear when placed in their correct planes in Figure 8. Traces moved to their correct planes Figure 8
Graphs • In Figure 9 we fit together the traces from Figure 8 to form the surface z = y2 – x2, a hyperbolic paraboloid. Notice that the shape of the surface near the origin resembles that of a saddle. Figure 9 The graph of f(x, y) = y2 – x2 is the hyperbolic paraboloid z = y2 – x2.
Graphs • The idea of using traces to draw a surface is employed in three-dimensional graphing software for computers. • In most such software, traces in the vertical planes x = k and y = k are drawn for equally spaced values of k and parts of the graph are eliminated using hidden line removal.
Graphs • Figure 10 shows computer-generated graphs of several functions. Figure 10
Graphs • Notice that we get an especially good picture of a function when rotation is used to give views from different vantage points. • In parts (a) and (b) the graph of f is very flat and close • to the xy-plane except near the origin; this is because • e–x2–y2is very small when x or y is large.
Quadric Surfaces • The graph of a second-degree equation in three variables x, y, and z is called a quadric surface. • We have already sketched the quadric surfaces z = 4x2 + y2 (an elliptic paraboloid) and z = y2 – x2(a hyperbolic paraboloid) in Figures 6 and 9. In the next example we investigate a quadric surface called an ellipsoid. The graph of f(x, y) = 4x2 + y2 is the elliptic paraboloid z = 4x2 + y2. Horizontal traces are ellipses; vertical traces are parabolas. The graph of f(x, y)= y2 – x2 is the hyperbolic paraboloid z = y2 – x2. Figure 6 Figure 9
Example 8 • Sketch the quadric surface with equation • Solution: • The trace in the xy-plane (z = 0) is x2 + y2/9= 1, which we recognize as an equation of an ellipse. In general, the horizontal trace in the plane z = k is • which is an ellipse, provided that k2 < 4, that is, –2 < k < 2.
Example 8 – Solution cont’d • Similarly, the vertical traces are also ellipses: • Figure 11 shows how drawingsome traces indicates the shape of the surface. Figure 11
Example 8 – Solution cont’d • It’s called an ellipsoid because all of its traces are ellipses. • Notice that it is symmetric with respect to each coordinate plane; this symmetry is a reflection of the fact that its equation involves only even powers of x, y, and z.
Quadric Surfaces • The ellipsoid in Example 8 is not the graph of a function because some vertical lines (such as the z-axis) intersect it more than once. But the top and bottom halves are graphsof functions. In fact, if we solve the equation of the ellipsoidfor z, we get
Quadric Surfaces • So the graphs of the functions • and • are the top and bottom halves of the ellipsoid (see Figure 12). Figure 12
Quadric Surfaces • The domain of both f and g is the set of all points (x, y) such that • so the domain is the set of all points that lie on or inside the ellipse x2 + y2/9= 1.
Quadric Surfaces • Table 2 shows computer-drawn graphs of the six basic types of quadric surfaces in standard form. Graphs of quadric surfaces Table 2
Quadric Surfaces cont’d • All surfaces are symmetric with respect to the z-axis. If a quadric surface is symmetric about a different axis, its equation changes accordingly. Graphs of quadric surfaces Table 2