Download
1 / 36
370 likes | 450 Views
Learn about global economic inequality, income disparity metrics like Range and Gini coefficient, and its impact on countries such as the US, India, and China.

E N D
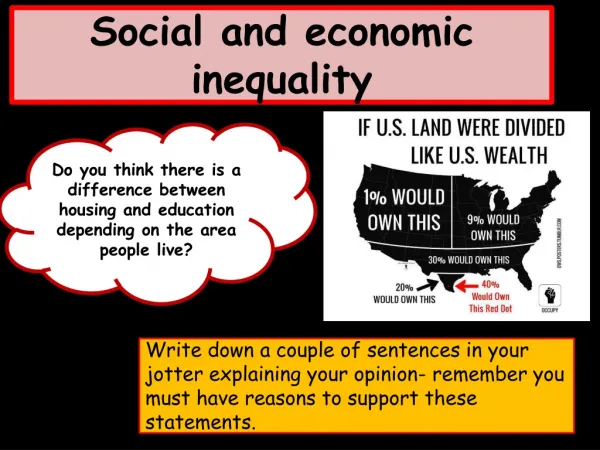
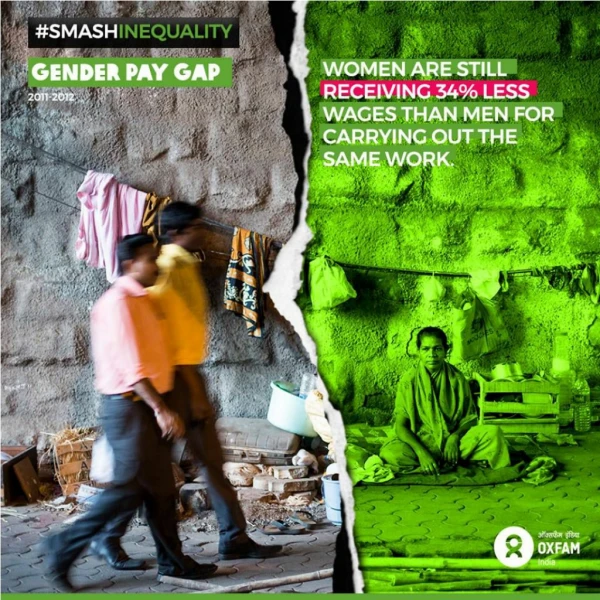
Economic inequality • Refers to disparities in the distribution of wealth and income
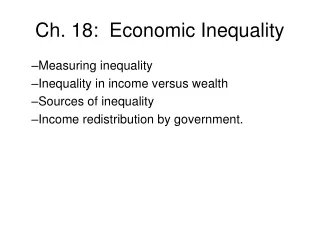
Economic inequality in the world can be measured in different ways • within-country inequality • between-country inequality • individual-level inequality • Wolf et al. call this “global economic inequality"
Types of income inequality • within-country inequality: disparities in the distribution of income within a country • between-country inequality: disparities in the distribution of income between countries • individual-level or “global” inequality: disparities in the distribution of income among individuals worldwide
There are different income inequality metrics • Range • Ratio • Gini coefficient
Range • Simply the difference between the highest and lowest observations of income (or wealth) • Reveals absolute gaps in income (or wealth)
Ratio • the ratio of the income of 2 different groups, generally higher over lower • compares 2 parts of the income distribution, rather than the distribution as a whole • equality between these parts corresponds to 1:1, while the more unequal the parts, the greater the ratio • can be calculated as "income share" – what percentage of national income a subpopulation accounts for • e.g., in 2007, the top 10% (decile) accrued 49.7% of all income in the US, considerably higher than 10%, which would hold in a condition of income equality (Saez 2009)
Gini coefficient • a measure of income inequality within a population, ranging from 0 for perfect equality (where e/o has same income), to 1 for perfect inequality (where one person has all the income) • population can be a country, a region, the world, etc. • can be used to compare populations or to study changes in a single population over time • It is defined as the area between the “Lorenz Curve” and the diagonal, divided by the total area under the diagonal
Differences in national income inequality by national Gini coefficients Ranges from approx. 0.23 (Sweden) to 0.70 (Namibia)
Incensed about Inequality Martin Wolf, Ch. 20, pp. 183-189 (Excerpted from Wolf, “Incensed about Inequality,” in Why Globalization Works, Yale, 2004)
Globalization has NOT increased inequality – not “global inequality” • Economic liberalization and int’l economic integration has not increased global inequality • Global inequality – understood as inequality among individuals – has declined, and so has global poverty
Still, between-country and within-country inequality isrising • Absolute & proportional gaps in living standards between world’s richest and poorest countries are rising • Inequality within the world’s big countries is rising, e.g., the US
Income inequality in the US (US Census Bureau data)
In India, two revolutions were critical for growth since the mid-1970s • the green revolution increased agricultural productivity, with introduction of pesticides, high-yield grains and better management during 1960s & 1970s • economic liberalization beginning in1980s
Economic liberalization has led to partial “convergence” • economic liberalization beginning in1980s has had greatest impact on China & India • China & India have almost 2/5s of world pop’n • China has more people than Latin America & sub-Saharan Africa combined
GL, by increasing economic growth, has reduced inequality and poverty • The # of people in extreme poverty fell from 1.18 billion in 1987 to 1.17 bil. in 1999 • Enormous declines in the # of people in extreme poverty have occurred in East Asia • The # of people in extreme poverty fell very modestly in south Asia (1990-1999), while it rose sharply in eastern Europe and central Asia and above all, sub-Saharan Africa • The regional incidence of poverty fell dramatically in east Asia • The regional incidence of poverty also fell sharply in south Asia
"Globalization, Growth, and Poverty" (World Bank, 2002) • 73 developing countries were divided into 2 groups • more globalized: the third that had increased ratios of trade to GDP since 1980 • less globalized: 2/3s of countries with declining in trade/GDP ratios
"Globalization, Growth, and Poverty" : Findings • Average per capita income in globalizers (more globalized countries) rose by 67% per year 1980-1997 • Note: 75% of globalizer group's combined population comes from India and China • Average per capita income in less globalized rose only about 10% in same period
"Globalization, Growth, and Poverty" : Implications • Results challenge idea that GL necessarily makes the rich richer, the poor poorer (as predicted by dependency theory, for example) • Success among globalizers did NOT require the full-range of so-called neoliberal policies • But successful countries all share a move towards a market economy, in which private property rights, free enterprise and competition took the place of state ownership, planning and protection
Is Globalization Reducing Poverty and Inequality? Wade, Ch. 21, pp. 190-196 (Excerpted from Wade, “Is Globalization Reducing Poverty and Inequality?,” World Development 32:4, 2004)
Two perspectives on globalization: neoliberal & anti-neoliberal • Neoliberal: sees GL as confirmation that open, liberalized economies are more prosperous • Anti-neoliberal: claims GL—in current neoliberal form—has caused in rising world poverty & inequality
Two sets of policy prescriptions • Neoliberal • GL flattening, “leveling of the playing field” • Policy prescription: more global economic integration (freer trade, more FDI, more capital market liberalization) • Anti-neoliberal • GL spiking inequality • Policy prescription: less global economic integration (limits on market forces)
GL divergence among regions • Period of accelerated globalization (1980 on) shows positive world per capita growth but also a wide divergence of economic performance between developing regions • GDP of developing countries as a group (population-weighted) grew faster than that of high-income countries • But regional variation within Global South is large
Regional inequality • What’s most striking in data is not overall growth trends, but the size of gaps • testimony to the failure of the poorest countries to "catch up"
World Bank's poverty figures contain a large margin of error • Poverty headcount is very sensitive to the precise level of the international poverty lines, which change • Poverty headcount is also sensitive to the reliability of household surveys of income and expenditure, which vary in quality • China and India, 2 most important countries for the overall trend, have PPP-adjusted income figures based on even more guesswork, or "guesstimates“ • 1990s change in data collection methodology makes comparisons over time unreliable
Still, it's plausible that the proportion of the world population in extreme poverty has fallen • Despite the problems with income figures, we know about trends in other variables, which all show improvement: • life expectancy • height • other nonincome measures
Economic inequality & poverty? • World poverty could decline while world inequality rises • There’s lots of disagreement about inequality • the trends depend on what combination of measures and countries we use
Prop. 1. World income distribution has become rapidly more unequal, when incomes are measured at market exchange rates (vs PPP exchange rates) and expressed in US dollars • Purchasing power parity exchange rate is calculated to yield absolute purchasing power parity • The PPP adjustment substantially raises the relative income of poor countries • e.g., India's PPP GDP is about 4 times its market exchange rate GDP • The PPP adjustment thus makes world income distribution look much more equal than the distribution of market exchange-rate incomes
Purchasing power parity (PPP) • To compare economic statistics across countries, data must first be converted into a common currency • Unlike conventional exchange rates, PPP exchange rates allow this conversion to take account of price differences between countries • Recently, PPP exchange rates have been calculated comparing the cost of a common basket of commodities in every country • By eliminating differences in national price levels, the method facilitates comparisons of real values for income, poverty, inequality and expenditure patterns
Empirical examples of the results of disparities in purchasing power • Countless migrants leave high prestige jobs in poor countries in order to make more money in less prestigious jobs in wealthy countries, sending a portion of their income back home in the form of remittances • Many working and middle class Americans have the option to live out their retirement in poorer countries, collecting social security payments and pensions, which though meager in the US context, can go relatively far in a poorer country
Big Mac Index, July 22, 2010 • Burgernomics is based on the theory of purchasing-power parity, the notion that a dollar should buy the same amount in all countries • Thus in the long run, the exchange rate between two countries should move towards the rate that equalizes the prices of an identical basket of goods and services in each country • Here "basket" = McDonald's Big Mac, which is produced in about 120 countries • Big Mac PPP = exchange rate that would mean hamburgers cost same in US & abroad • Comparing actual exchange rates w/ PPPs indicates whether a currency is under- or overvalued • [The Economist, http://www.economist.com/markets/bigmac/about.cfm]
Prop. 2. World PPP-income polarization has increased, with polarization measured as richest to poorest decile • Contrast between what top 10% can buy with income (concentrated in core countries) and what bottom 10% (mostly in Africa) can buy • The polarizing trend is even sharper if you look at top 1% and bottom 1%
Prop. 3. Between-country world PPP income inequality has increased since at least 1980, using per capita GDPs, equal country weights (China = Uganda), and Gini coefficient for the whole distribution • By weighing countries equally – treating each country as a unit of observation – we can test growth theory and the growth impacts of public policies, resource endowments, etc. • e.g., we can arrange countries by the openness of their trade policies and see whether more open countries have better economic performance
Prop. 4. Between-country world PPP-income inequality has been constant or falling since around 1980 - with countries weighted by population • This is the trend the neoliberal argument celebrates, but there are 2 problems: • 1) exclude China, and this measure shows a widening 2) exclude India and it's more pronounced Thus, falling income inequality is NOT a general feature of the world economy • China and India have 38% of world population, so they shape trends in world poverty • China's avg PPP income rose from about 1/3 of world avg in 1990 to almost ½ in 1998 • There are problems w/PPP measurements in both countries b/c they didn’t participate in int'l price comparisons on which PPP calculations are based
Prop. 4. (cont’d) • There's rising inequality in both countries, esp by region • Ratio of avg income of the richest to poorest province in China rose from 3.2 in ’91 to 4.8 in ’93, where it remained in ’98-2001; India’s was 4.2, the US’ 1.9 in the late 90s • Dispersion in pay rates in manufacturing have steadily widened since the early 1980s • Absolute income gaps are widening fast
“Globalization, Growth, and Poverty” (World Bank 2002) • Less globalized/more globalized is calculated on basis of changes in trade/GDP ratio 1977-97 • trade/GDP ratio is the sum of exports and imports divided by the GDP • Data show that more globalized countries have faster economic growth, no increase in inequality, and faster reduction of poverty than the latter, BUT the classifications are dubious • Using “change in trade/GDP ratio” as measure of globalization skews the results • It’s possible that more globalized countries are less open than many less globalized countries, in terms of trade/GDP and size of tariff and nontariff barriers • Many globalizers initially had very low trade/GDP ratios and still had relatively low ratios at end of period • “To call relatively closed economies “more globalized” and to call countries with much higher ratios of trade/GDP and much freer trade regimes “less globalized” is an audacious use of language” (196)
Conclusion: Falling inequality is not a generalized feature of the world economy • Several studies suggest that world income inequality has been rising • The trend is sharpest when incomes are measured at market-exchange rates • PPP-adjusted incomes, in principle, are more relevant to relative economic well-being, but market exchange rates are highly relevant to state capacity, inter-state power, and the dynamics of capitalism • One combination of inequality measures does find that income inequality has been falling – PPP income per capita weighted by population (Prop. 4) – but exclude China and even this metric shows rising inequality • Absolute income gaps are continuing to widen