Download
1 / 35
350 likes | 594 Views
Web Site Delays: How Slow Can You Go?. Presented by Dennis F. Galletta University of Pittsburgh Co-authors: Raymond Henry Scott McCoy Peter Polak. Background. Online consumer spending: $4 billion/month (Forrester, Oct. 2002)

E N D
Web Site Delays: How Slow Can You Go? Presented by Dennis F. Galletta University of Pittsburgh Co-authors: Raymond Henry Scott McCoy Peter Polak
Background • Online consumer spending: $4 billion/month (Forrester, Oct. 2002) • only 1% of overall consumer spending! (US Bureau of Economic Analysis, 2002) • Majority of users attempt to find product information, but have problems (GVU, 1999) • Failure to find the products • Need repeated clicks due to confusing or disorganized sites • Delay (“World Wide Wait”)
What is the difficulty? • Speed (or lack of it) is probably the core problem (Lightner & Bose, 1996) • Delay makes each click very “costly” (Shneiderman 1998) • Extra clicks on hyperlinks are a result of: • Web site depth (clicks from top to final node) • Failing to click on the proper link • Unfamiliarity with site’s structure • Unfamiliarity with site’s terminology
Benefits of Speed • Some practitioners have studied the problem of delay • Most popular sites are the fastest ones Nielsen (1999) • Improving page load speeds from 8 seconds and up to 2-5 seconds doubles site traffic (Wonnacott, 2000) • Page loading delay of 8 seconds and up costs the economy $4.35 billion per year (Zona, 1999)
Delay: Can’t Be Solved by High-Speed Broadband • Causes of delay: • Congestion • At user’s host • At user’s LAN • At server • Excessive data • Misconfiguration • And yes, narrow bandwidth • We now have global waiting lines! • To keep up the speed, multiple servers are used (Google example)
Future Prospects are Bleak • Only 14% of U.S. households have high-speed broadband now (Dataquest, 2002) • By 2005, 36% will have high-speed (Media Metrix, 2001) • But network traffic growth continues to outgrow upgrades in bandwidth (Sears & Jacko, 2000; Nielsen, 1999) • Expanding broadband population can require server upgrades (Connolly, 2000)
Research Questions • Which “rule of thumb” can be supported? • In research examining speed, what threshholds should be used? • Is there a diminishing impact of additional delay? Is the distribution linear or curvilinear? • What factors interact with delay?
Speed (response time) • A factor in usability for a long time • Effects of long response time: • dissatisfaction (Lee & MacGregor, 1985) • feelings of being lost (Sears, et al. 2000) • low user performance (Butler, 1983) • low productivity (Dannenbring, 1983) • Negative outcomes can reflect on the site itself • If cause appears unnecessary (gratuitous graphics) • If delays are longer than expected or unpredictable • If there is no status information (Dellaert & Kahn, 1999)
What is tolerable? • Many numbers have been used as the maximum delay • Some studies imposed delays of minutes! • 15 seconds: “disruptive” (Shneiderman, 1998) • 12 seconds: “intolerable” (Hoxmeier & DiCesare, 2000) • 10 seconds: “loss of interest” (Ramsay et al., 1998) • 8 seconds (commonly targeted): “psychological and performance consequences” (Kuhmann, 1989) (also see Hoxmeier & DiCesare 2000, Ramsay et al. 1998, Zona 1999, Shneiderman, 1998) • 2 seconds: “loss of conversational nature”(Miller, 1968) • Miller’s 2 second rule has been a “gold standard” for decades (Nielsen, 1999) • These delays are all plausible as a maximum
Behavioral Outcomes of Long Delay • Users become frustrated then seek alternative sites (Ranganathan and Ganapathy, 2002) • Intentions to return are impaired (Galletta et al., 2002; Hoxmeier & DeCesare, 2000) • Increased frequency of aborting downloads (Rose et al., 2001)
Attitudinal Outcomes of Long Delay • Pages were seen as less interesting and harder to scan (Ramsay et al. 1998) • Perceptions of lower page quality and poorer organization if excessive use of graphics (Jacko et al. 2000) • Impaired satisfaction (Hoxmeier & DiCesare 2000, Carbonell et al. 1968) • Our follow-up shows that effects of long delay are minimized if site follows familiar structure in navigation links and the site is not deep (Galletta et al. 2002)
Performance Outcomes of Long Delay • Impaired performance (Carbonell et al. 1968, Goodman & Spence 1978, Thadhani 1981) • Strongest effects (Galletta et al. 2002, Polak 2002) • Users altered strategies to accommodate system response patterns (Yntema, 1968, Carbonell et al. 1968) • Dramatic performance declines from .7 to 1.5 to 3.2 seconds (Goodman & Spence 1978) • Performance declined when delays exceeded 1 second (Thadhani 1981) • Caution 1: This effect only holds with tasks that are rather simple. (Bergman et al. 1981, Butler 1983) • Caution 2: Errors are less of an aggravation with fast response (Dannenbring 1984)
Study I: Methodology • Lab experiment • Delays of 0, 2, 4, 6, 8, 10, and 12 seconds were randomly assigned • Delays chosen to represent values well above maximum of 8 often recommended • Longer delays would not be justified by the modest graphical content (Sears & Jacko 2000) • Two sites: one “familiar” and one “unfamiliar”
Experimental Design • Two sites per user, each saw one familiar and one unfamiliar site, half UF and half FU (completely counterbalanced) • Delay was a between-subjects factor
Instruments • Attitudes: 6 items, 9-point scale (alpha = .86) (one was dropped) • Items adapted from the QUIS instrument (from Chin’s thesis and Shneiderman 1998) • Behavioral Intentions: 2 items, 7-point scale (alpha = .94) • Items developed for this study • Performance: 9 dichotomous search tasks (KR-20 = .90) • Items developed for this study
Subjects • 32 subjects in pre-test • 196 Undergraduate Business majors volunteered for main study (nearly 100%) • Instructors offered extra credit • Randomly assigned to treatments
Procedure • Web sites created on CD to control response times • Labs contained identical computers • Javascript program on each page assigned a delay based on a “cookie” set by a packet code
Results – Best View is Visual Attitudes Performance Behavioral Intentions
Sensitivity Analysis • To find the point at which outcome variables no longer decline significantly • Recursive procedure: • Remove the lowest delay • Re-run regression
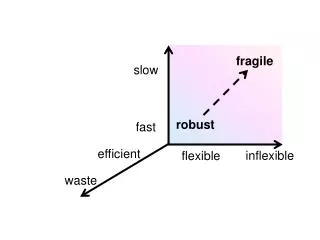
Conclusions • Negative impacts from increases in delay follow a (mostly) consistent pattern • The pattern fits a nonlinear curve as expected (better than linear) • Relatively small increases in delay provide significant effects • In general, maximum degradation is reached at 4 second point • Exception: maximum degradation of attitudes seems to be higher for familiar sites (6-8 sec)
Conclusions • Obvious tip: minimize page loading time • But the tip is especially important when a site is likely to be unfamiliar • That is, if a site is likely to have high unfamiliarity, speed it up as much as possible • If the site is slow, broaden it • If a site is likely to have high unfamiliarity, broaden it • If a site has a great deal of familiarity, it can be slow and relatively deep
3-way interaction 2-way interaction main effect Familiarity H3 H7 H6 Speed Behavioral Intentions Attitudes Performance H1 H8 H5 H4 Depth H2 Figure 1: Research Model Study II – Depth, Breadth and Speed
Main Effects • All significant • Speed: Faster was better • Depth: Broad is better • Familiarity: Familiar is better
Three-Way Interaction • Significant but only for attitudes and performance
Study III – Two new factors • Speed • Variability – variation in loading speed • Feedback – graphics and text visibly loading while page loads • Accomplished in “beats”
Results – all studies • Again, speed is of utmost importance • If longer than 2 seconds, be especially careful with familiarity and depth • If very fast, sins are forgiven (with apologies to Dean von Dran!)
Web Site Delays: How Slow Can You Go? Presented by Dennis F. Galletta University of Pittsburgh Co-authors: Raymond Henry Scott McCoy Peter Polak