Download

1 / 46
460 likes | 596 Views
This article explores the complexities of analyzing high-dimensional genomic data, specifically focusing on the classification of microarray expression profiles in cancer prediction. Using patient Ms. Smith as a case study, it discusses how to predict tumor types by learning from known patient profiles. The methods of training and prediction, including the use of linear discriminant analysis and feature reduction, are examined. We also analyze the challenges of overfitting and the importance of independent validation for accurate model performance.

E N D
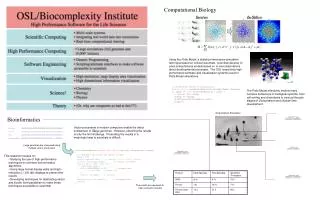
‘Omics’ - Analysis of high dimensional Data Achim TreschComputational Biology
Classification Expressionprofile ofMs. Smith Ms. Smith Microarray ofMs. Smith
Classification The 30.000 properties of Mrs. Smith The expression profile ... - a list of 30,000 numbers - some of them reflect her health problem (e.g., cancer) -the profile is an image of Ms. Smith‘s physiology How can these numbers tell us (predict) whether Ms. Smith has tumor type A or tumor type B ?
Classification Looking for similarities ? Mrs. Smith Compare her profile to profiles of people with tumor type A and to patients with tumor type B
Training and Prediction There are patients of known class, the training samples Mrs. Smith There are patients of unknown class, the ”new“ samples
Training and Prediction Use the training samples ... Mrs. Smith ... to learn how to predict ”new“ samples
Prediction using one Gene Color coded expression levels of trainings samples A B Ms. Smith type A Ms. Smith type B Ms. Smith borderline Which color shade is a good decision boundary?
Optimal decision rule Use the cutoff with the fewest misclassifications on the trainings samples Smallest training error Distribution of expression values in type B Decision boundary B A Distribution of expression values in type A Training error
Optimal decision rule Training error The decision boundary was chosen to minimize the training error The two distributions of expression values for type A and B will be similar but not identical in a set of new cases We can not adjust the decision boundary because we do not know the class of the new samples Test errors are usually larger then training errors This phenomenon is called overfitting Training set Test set Test error
Combining information across genes Taking means across genes The top gene The average of the top 10 genes ALL vs. AML Golub et al.
Combining information across genes Using a weighted average with “good weights” you get an improved separation Expression values weights
Combining information across genes The geometry of weighted averages Calculating a weighted average is identical to projecting (orthogonally) the expression profiles onto the line defined by the weights vector (of length 1).
A B Linear decision rules Hyperplanes 3 genes 2 genes Together with an offset β0 the weight vector defines a hyperplane that cuts the data in two groups
A B Linear decision rules Linear Signatures If y≥0 Disease A If y<0 Disease B 2 genes
Linear Discriminant Analysis Diagonal Linear Discriminant Analysis (DLDA) Rescale axis according to the variances of genes
Linear Discriminant Analysis Discriminant Analysis The data often shows evidence of non identical covariances of genes in the two groups Hence using LDA, DLDA or NC introduces a model biad (=wrong model assumptions, here due to oversimplification)
Feature Reduction Gene Filtering - Rank genes according to a score - Choose top n genes - Build a signature with these genes only Still 30.000 weights, but most of them are zero … Note that the data decides which are zero and which are not Limitation: You have no(?) chance to find these two genes among 30,000 non-informative genes
Feature Reduction How many genes? Is this a biological or a statistical question? Biology: How many genes carry diagnostic information? Statistics: How many genes should we use for classification ? The microarray offers 30.000 genes or more
Feature Reduction Finding the needle in the haystack A common myth: Classification information in gene expression signatures is restricted to a small number of genes, the challenge is to find them
Feature Reduction The Avalanche Aggressive lymphomas with and without a MYC-breakpoint MYC-neg MYC-pos Verbundprojekt maligne Lymphome
Cross Validation Independent Validation Training error The accuracy of a signature on the data it was learned from is biased because of the overfitting phenomenon Validation of a signature requires independent test data Training set Test set Test error
Cross Validation Generating Test Sets Split data randomly into … test … … and training data Learn the classifier on the training data, and apply it to the test data okmistake
Train Train Eval Train Train Train Train Train Eval Train Cross Validation n-fold Cross-Validation (n=5) … Cross validation evaluates the algorithm with which the signature was build Gene selection and adjustment of all parameters must be repeated for every learning step within the training sample of the cross validation
Cross Validation Estimators of performance have a variance … … which can be high. The chances of a meaningless signature to produce 100% accuracy on test data is high if the test data includes only few patients Nested 10-fold- CV Variance from 100 random partitions
Bias & Overfitting The gap between training error and test error becomes wider There is a good statistical reason for not including hundreds of genes in a model even if they are biologically effected
Centroid Shrinkage genes genes The shrunken centroid method and the PAM package Tibshirani et al 2002 genes genes genes genes genes genes genes genes genes genes genes genes genes
Centroid Shrinkage Shrinkage D
Centroid Shrinkage How much shrinkage is good in PAM (partitioning around medoids? Train Train Select Train Train cross validation Train Train Train Select Train Compute the CV-Performance for several values of D Pick the D that gives you the smallest number of CV-Misclassifications Adaptive Model Selection PAM does this routinely
Selection Bias The test data must not be used for gene selection or adaptive model selection, otherwise the observed (Cross Validation-based) accuracy is biased Selection bias
Cross Validation Small D, many genes poor performance due to overfitting High D, few genes, poor performance due to lack of information– underfitting- The optimal D is somewhere in the middle
Predictive genes are not causal genes Assume protein A binds to protein B and inhibits it The clinical phenotype is caused by active protein A Predictive information is in expression of A minus expression of B Calling signature genes markers for a certain disease is misleading! Naïve Idea: Don’t calculate weights based on single gene scores but optimize over all possible hyperplanes
Optimal decision rules Only one of these problems exists Problem 1: No separating line Problem 2: Many separating lines Why is this a problem?
Optimal decision rules This problem is related to overfitting ... more soon
The p>N problem With the microarray we have more genes than patients Think about this in three dimensions There are three genes, two patients with known diagnosis (red and yellow) and Ms. Smith (green) There is always one plane separating red and yellow with Ms. Smith on the yellow side and a second separating plane with Ms. Smith on the red side OK! If all points fall onto one line it does not always work. However, for measured values this is very unlikely and never happens in practice.
The p>N problem The overfitting disaster From the data alone we can not decide which genes are important for the diagnosis, nor can we give a reliable diagnosis for a new patient This has little to do medicine. It is a geometrical problem. If you find a separating signature, it does not mean (yet) that you have a top publication ... ... in most cases it means nothing.
Finding meaningful signatures There always exist separating signatures caused by overfitting - meaningless signatures - Hopefully there is also a separating signature caused by a disease mechanism, or which at least are predictive for the disease - meaningful signatures – We need to learn how to find and validate meaningful signatures
Separating hyperplanes Which hyperplane is the best?
Support Vector Machines (SVMs) Fat planes: With an infinitely thin plane the data can always be separated correctly, but not necessarily with a fat one. Again if a large margin separation exists, chances are good that we found something relevant. Large Margin Classifiers
Support Vector Machines (SVMs) Maximal Margin Hyperplane There are theoretical results that the size of the margin correlates with the test (!) error (V. Vapnik) SVMs are not only optimized to fit to the training data but for predictive performance directly
Support Vector Machines (SVMs) No separable training set Penalty of error: distance to hyperplane multiplied by a parameter c Balance over- and underfitting
External Validation and Documentation • Documenting a signature is conceptually different from giving a list of genes, although is is what most publications give you • In order to validate a signature on external data or apply it in practice: • All model parameters need to be specified • The scale of the normalized data to which the model refers needs to be specified
External Validation Cross Validation:Split Data intoTraining and Test Data - select genes - find the optimal number of genes Training data only: Machine Learning - learn model parameters Establishing a signature
Cookbook for good classifiers 1. Decide on your diagnosis model (PAM,SVM,etc...) and don‘t change your mind later on 2. Split your profiles randomly into a training set and a test set 3. Put the data in the test set away ... far away! 4. Train your model only using the data in the training set (select genes, define centroids, calculate normal vectors for large margin separators, perform adaptive model selection ...) don‘t even think of touching the test data at this time 5. Apply the model to the test data ... don‘t even think of changing the model at this time 6. Do steps 1-5 only once and accept the result ... don‘t even think of optimizing this procedure
Acknowledgements Rainer Spang, University of Regensburg Florian Markowetz,Cancer Research UK, Cambridge