Download
1 / 46
460 likes | 645 Views
Summary of Lowest Lead Levels for Lead-induced Side Effects. ATSDR, US Department of Health and Human Services. Toxicological Profile for Lead, 1990. Chronic Lead Exposure Can Produce Chronic Interstitial Nephritis. Progressive tubular atrophy Interstitial fibrosis Renal insufficiency

E N D
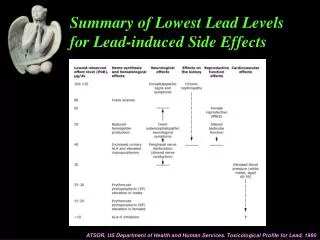
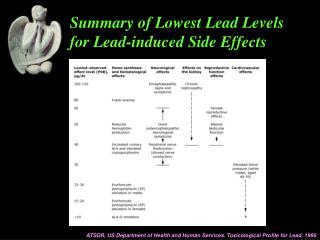
Summary of Lowest Lead Levels for Lead-induced Side Effects ATSDR, US Department of Health and Human Services. Toxicological Profile for Lead, 1990
Chronic Lead Exposure Can Produce Chronic Interstitial Nephritis • Progressive tubular atrophy • Interstitial fibrosis • Renal insufficiency • Gout related to hyperuricemia
Pathogenesis & Pathology • Proximal tubule reabsorption of filtered lead, with accumulation in the proximal tubule cells • Proximal tubular injury with intranuclear inclusion bodies composed of a lead-protein complex
Proximal tubule of lead-exposed rat: Intranuclear inclusion bodies in the proximal tubule cell and loss of brush border and cells Sanchez-Fructuoso AI, Am J Kidney Dis, 2002
Medium-sized artery in the kidneys of lead-exposed (A) and control rats (B): Hypertrophy and vacuolization affecting the artery of the lead-exposed rat Sanchez-Fructuoso AI, Am J Kidney Dis, 2002
Arteriole in lead-exposed (A) and control (B) rat kidneys: Muscular hypertrophy in the arteriole of the lead-exposed rat Sanchez-Fructuoso AI, Am J Kidney Dis, 2002
Putative mechanisms involved in the luminal uptake of heavy metals along the nephron Barbier O, Nephron Physiol, 2006
Common Mechanisms in Metal Induced Nephrotoxicity Sabolic I, Nephron Physiol, 2006
Clinical Manifestations • Early manifestations reflect impaired proximal tubular function • Hyperuricemia, aminoaciduria, glucosuria • Late stages • Chronic renal insufficiency, hypertension, gout
Common Sources of Lead Exposure • Occupational involvement in the manufacture or destruction of lead-containing batteries or lead-containing aerosols in the workplace • Ingestion of moonshine whiskey • In Children: ingestion of paint or residence near a major highway (leaded gasoline)
Diagnosis • Blood lead level: recent (2-3 weeks) ingestion • Rise in urinary lead excretion after EDTA infusion: excess lead burden in tissues • X-ray fluorescence: increased bone lead levels • Low gamma-aminolevulinic acid dehydratase (ALAD)-restored to ALDA ratio: correlated well with urine lead excretion
Blood Lead Levels Considered Toxic • Prior to 1971: 60 µg/dL • 1972-1975: 40 µg/dL • 1975-1985: 30 µg/dL • 1985-1991: 25 µg/dL • 1991-present: 10 µg/dL
Impairment of renal function with increasing BLL in general population • A random sample of 965 men and 1016 women [age: 20-88 years, blood lead level (BLL):7.5 & 11.4 µg/dl. Ccr: 99 & 80 ml/min] • The Ccr was inversely correlated with blood lead both before and after adjustments for age, BMI, and diuretic treatment • A 10-fold increase in blood lead level was associated with a reduction of10 to 13 ml/min in Ccr Staessen JA, New Engl J Med, 1992
A longitudinal study of low-level lead exposure and impairment of renal function: The Normative Aging Study • 459 men randomly selected between 1979 and 1994 • After adjustment for age, BMI, smoking, alcohol, education, and hypertension, BLL was positively associated with concurrent serum Cr (P=.005) • A 10-fold increase in BLL predicted an increase of 0.08 mg/dL in serum Cr, which is roughly equivalent to the increase predicted by 20 years of aging Kim R, JAMA, 1996
The Normative Aging Study • The age-related increase in serum Cr was earlier and faster in the group with the highest-quartile BLL Kim R, JAMA, 1996
Occult lead intoxication as a cause of hypertension and renal failure By an EDTA test, 296 patients: • Normal (30 patients) • Chronic renal failure of known etiology (30 patients) • Essential hypertension and normal renal function (104 patients) • Renal failure of unknown etiology with hypertension and/or gout (132 patients) Sanchez-Fructuoso AI, Nephrol Dial Transplant, 1996
Occult lead intoxication as a cause of hypertension and renal failure • No patient had a history of overt lead toxicity • Elevated lead levels were found in 16 patients (15 %) with essential hypertension, and 74 patients (56%) in the last group Sanchez-Fructuoso AI, Nephrol Dial Transplant, 1996
Blood lead and CKD in the general US population: NHANES III • N = 15211 • Among persons with and without hypertension, mean blood lead was 4.21 and 3.30 µg/dL, respectively, the prevalence of elevated serum Cr was 11.5% and 1.8%, respectively, and CKD was 10.0% and 1.1%, respectively Muntner P, Kidney Int, 2003
Blood lead and CKD in the general US population: NHANES III • Among persons with hypertension, a graded association was present between higher quartile of blood lead and a higher odds ratio of both an elevated serum Cr and CKD. • Comparing the highest to lowest quartile of blood lead, the multivariate adjusted odds ratio (95% CI) of an elevated serum Cr and CKD were 2.41 (1.46, 3.97) and 2.60 (1.52, 4.45), respectively. Muntner P, Kidney Int, 2003
Blood lead and CKD in the general US population: NHANES III • Among the population without hypertension, elevated serum Cr and CKD were not associated with blood lead for any subgroups except for persons with diabetes where higher blood lead was associated with a higher prevalence of CKD. • In the United States population with hypertension, exposure to lead, even at low levels, is associated with CKD. Muntner P, Kidney Int, 2003
Blood lead and CKD in the general US population: NHANES III With hypertension Without hypertension Muntner P, Kidney Int, 2003
Environmental Exposure to Lead and Progression of CKD • A 4-year prospective longitudinal study • To elucidate the long-term relationship between low-level environmental lead exposure and progression of CKD in patients without diabetes • N = 121 YU CC, J Am Soc Nephrol, 2004
Environmental Exposure to Lead and Progression of CKD • 63 patients had body lead burden (BLB) ≧80 µg and < 600 µg (high-normal group): BLL 3.4 ±1.3 µg/dl • 58 patients had BLB < 80 µg (low-normal group): BLL 4.9 ±2.6 µg/dl • The primary end point was an increase in the serum Cr level to double the baseline value YU CC, J Am Soc Nephrol, 2004
Significantly more patients with high-normal body lead burden reached the primary end point YU CC, J Am Soc Nephrol, 2004
Environmental Exposure to Lead and Progression of CKD • The BLB and BLL at baseline were the most important risk factors to predict progression of renal insufficiency. • Each increase of 10 µg in the BLB or 1 µg/dl in the BLL reduced the GFR by 1.3 (P = 0.002) or 4.0 ml/min (P = 0.01) during the study period. YU CC, J Am Soc Nephrol, 2004
Environmental Exposure to Lead and Progression of CKD • Low-level environmental lead exposure is associated with accelerated deterioration of renal insufficiency. Even at levels far below the normal ranges, both increased BLL and BLB predict accelerated progression of chronic renal diseases. YU CC, J Am Soc Nephrol, 2004
The less steep decrease in GFR associated with higher blood lead in persons without hypertension suggests that renal function per se dose not cause increased BLL. Blood lead and CKD in the general US population: NHANES III Muntner P, Kidney Int, 2003
Chronic renal failure or dialysis treatment per se does not lead to bone lead accumulation Lead concentration and lead/calcium ratio in bone of dialysis patients vs. subjectswith normal renal function D’Haese PC, Clinical Chemistry, 1999
Low-level environmental lead exposure may accelerate progressive renal insufficiency in patients without diabetes who have chronic renal disease. Repeated chelation therapy may improve renal function and slow the progression of renal insufficiency. Lin JL, New Engl J Med, 2001
Lead, Diabetes, Hypertension, and Renal Function: the Normative Aging Study • A prospective study, examining changes in renal function during 6 years in relation to baseline lead levels, diabetes, and hypertension among 448 middle-age and elderly men, a subsample of the Normative Aging Study. • Lead levels were generally low at baseline, with mean blood lead, patella lead, and tibia lead values of 6.5 µg/dL, 32.4 µg/g, and 21.5 µg/g, respectively. Tsaih SW, Environ Health Perspect, 2004
Lead, Diabetes, Hypertension, and Renal Function: the Normative Aging Study • longitudinal decline of renal function among middle-age and elderly individuals appears to depend on both long-term lead stores and circulating lead, with an effect that is most pronounced among diabetics and hypertensives, subjects who likely represent particularly susceptible groups. Tsaih SW, Environ Health Perspect, 2004
Environmental exposure to lead and progressivediabetic nephropathy in patients with type II diabetes • Low-level environmental lead exposure accelerates progressive diabetic nephropathy and lead-chelation therapy can decrease its rate of progression. Lin JL, Kidney Int, 2006
Low-level Environmental Exposure to Lead and Progressive Chronic Kidney Diseases • 108 CKD patients (serum Cr: 1.5-2.9 mg/dL, BLL 2.9 ±1.4 µg/dl, BLB 40.2 ±21.2 µg) with low-normal BLB (<80 µg) and no lead exposure history were observed for 24 months. • Following the observation, 32 patients with low-normal BLB (≧20 µg and <80 µg) were randomly assigned to chelation and control groups. Lin JL, Am J Med, 2006
Low-level Environmental Exposure to Lead and Progressive Chronic Kidney Diseases Lin JL, Am J Med, 2006
Low-level Environmental Exposure to Lead and Progressive Chronic Kidney Diseases Lin JL, Am J Med, 2006
Low-level Environmental Exposure to Lead and Progressive Chronic Kidney Diseases Lin JL, Am J Med, 2006
Low-level Environmental Exposure to Lead and Progressive Chronic Kidney Diseases • Environmental exposure to lead, even at low levels, may accelerate progressive renal insufficiency of nondiabetic patients with CKD. Lin JL, Am J Med, 2006
Additional Factors in Accessing Lead Induced Nephrotoxicity • Coexposure of other toxic metals, such as cadmium • Aminolevulinic acid dehydratase (ALAD) polymorphism ( Wu MT, environ Health Perspect 2003) • Lead-related hyperfiltration in the early stages ( Khalil-Manesh F, Arch Environ Health 1993; Weaver VM, Occup Environ Med 2003)
Conclusions • Chronic lead exposure can produce a chronic interstitial nephritis. • Populations with diabetes, hypertension and/or CKD appear to be at great risk for adverse renal effects from lead. • Environmental exposure to lead, even at low levels, may accelerate progressive renal insufficiency.