Download
1 / 11
110 likes | 239 Views
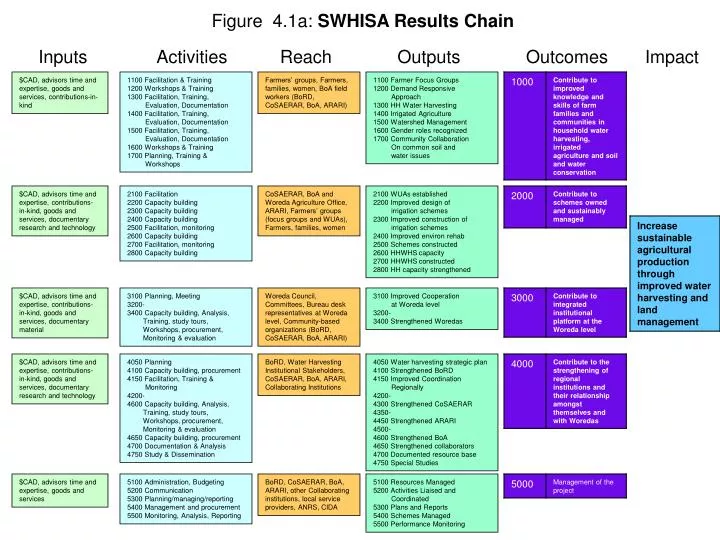
Figure 4.1a: SWHISA Results Chain. Inputs. Activities. Reach. Outputs. Outcomes. Impact. $CAD, advisors time and expertise, goods and services, contributions-in-kind. 1100 Facilitation & Training 1200 Workshops & Training 1300 Facilitation, Training, Evaluation, Documentation

E N D
Figure 4.1a: SWHISA Results Chain Inputs Activities Reach Outputs Outcomes Impact $CAD, advisors time and expertise, goods and services, contributions-in-kind 1100 Facilitation & Training 1200 Workshops & Training 1300 Facilitation, Training, Evaluation, Documentation 1400 Facilitation, Training, Evaluation, Documentation 1500 Facilitation, Training, Evaluation, Documentation 1600 Workshops & Training 1700 Planning, Training & Workshops Farmers’ groups, Farmers, families, women, BoA field workers (BoRD, CoSAERAR, BoA, ARARI) 1100 Farmer Focus Groups 1200 Demand Responsive Approach 1300 HH Water Harvesting 1400 Irrigated Agriculture 1500 Watershed Management 1600 Gender roles recognized 1700 Community Collaboration On common soil and water issues $CAD, advisors time and expertise, contributions-in-kind, goods and services, documentary research and technology 2100 Facilitation 2200 Capacity building 2300 Capacity building 2400 Capacity building 2500 Facilitation, monitoring 2600 Capacity building 2700 Facilitation, monitoring 2800 Capacity building CoSAERAR, BoA and Woreda Agriculture Office, ARARI, Farmers’ groups (focus groups and WUAs), Farmers, families, women 2100 WUAs established 2200 Improved design of irrigation schemes 2300 Improved construction of irrigation schemes 2400 Improved environ rehab 2500 Schemes constructed 2600 HHWHS capacity 2700 HHWHS constructed 2800 HH capacity strengthened $CAD, advisors time and expertise, contributions-in-kind, goods and services, documentary material 3100 Planning, Meeting 3200- 3400 Capacity building, Analysis, Training, study tours, Workshops, procurement, Monitoring & evaluation Woreda Council, Committees, Bureau desk representatives at Woreda level, Community-based organizations (BoRD, CoSAERAR, BoA, ARARI) 3100 Improved Cooperation at Woreda level 3200- 3400 Strengthened Woredas $CAD, advisors time and expertise, contributions-in-kind, goods and services, documentary research and technology 4050 Planning 4100 Capacity building, procurement 4150 Facilitation, Training & Monitoring 4200- 4600 Capacity building, Analysis, Training, study tours, Workshops, procurement, Monitoring & evaluation 4650 Capacity building, procurement 4700 Documentation & Analysis 4750 Study & Dissemination BoRD, Water Harvesting Institutional Stakeholders, CoSAERAR, BoA, ARARI, Collaborating Institutions 4050 Water harvesting strategic plan 4100 Strengthened BoRD 4150 Improved Coordination Regionally 4200- 4300 Strengthened CoSAERAR 4350- 4450 Strengthened ARARI 4500- 4600 Strengthened BoA 4650 Strengthened collaborators 4700 Documented resource base 4750 Special Studies $CAD, advisors time and expertise, goods and services 5100 Administration, Budgeting 5200 Communication 5300 Planning/managing/reporting 5400 Management and procurement 5500 Monitoring, Analysis, Reporting BoRD, CoSAERAR, BoA, ARARI, other Collaborating institutions, local service providers, ANRS, CIDA 5100 Resources Managed 5200 Activities Liaised and Coordinated 5300 Plans and Reports 5400 Schemes Managed 5500 Performance Monitoring
Figure 4.1d:Extension (1000) Work Breakdown Structure (con’t)
Figure 4.1f: Schemes (2000) Work Breakdown Structure (con’t)
Figure 4.1g: Woreda Platform (3000) Work Breakdown Structure
Figure 4.1h: Regional Institutions (4000) Work Breakdown Structure
Figure 4.1i: Regional Institutions (4000) Work Breakdown Structure (con’t)