Download
1 / 65
650 likes | 764 Views
Hypothesis Testing of Qualitative Data. Connecting Probability Concepts in a logical way to develop the formulas used for testing hypotheses. By Pete Kaslik Pierce College, Ft. Steilacoom. The Need To Do Statistics Begins With A Question That Leads to a Decision .

E N D
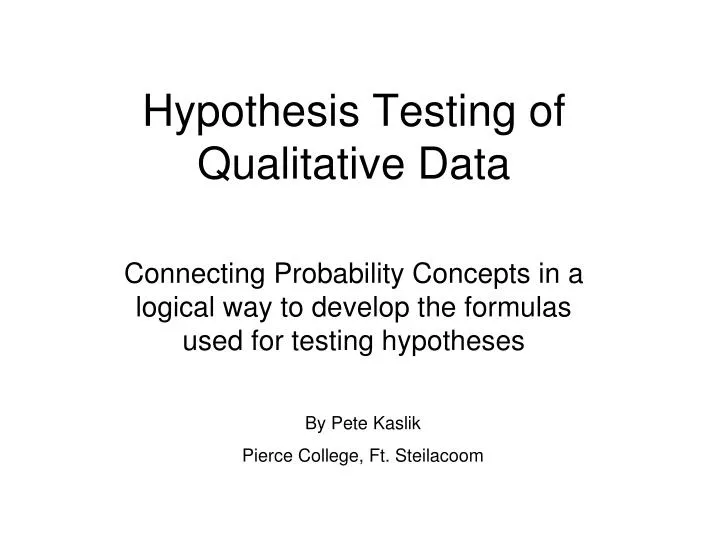
Hypothesis Testing of Qualitative Data Connecting Probability Concepts in a logical way to develop the formulas used for testing hypotheses By Pete Kaslik Pierce College, Ft. Steilacoom
The Need To Do Statistics Begins With A Question That Leads to a Decision
It is typical that the decision usually has financial or health implications.
For the purposes of this demonstration, the question is whether the US should allow drilling for oil in the Pacific Ocean and in the Arctic Ocean
We will assume there are only 2 possible points of view on this.
1. Our lifestyles require oil and therefore we should get oil no matter where it is and no matter the possible consequences.
2. We have already gotten the easiest oil and the potential consequences of drilling in the ocean outweigh the benefits. Therefore we should transition to an oil-free society instead of drilling for more.
Before analyzing data, it is useful to understand the topic.Following is a brief explanation of the oil issue.
Hubbert • In 1956, M King Hubbert, a petroleum geologist explained that oil field production follows a normal curve. That is, it starts slow, increases to a peak and then declines. The same curve applies to countries and the world. • He predicted that the US would peak in the early 1970s.
US Oil Production and Consumption (and population) Notice how much more we consume than produce, hence the reason for all the imports. Notice the peak in US oil production around 1970
World Oil Production World oil production history and projections (left) are produced by the US Energy Information Administration (EIA) and are available on the website: http://www.eia.gov/pub/oil_gas/petroleum/presentations/2000/long_term_supply/sld001.htm. These projections were made in 2000, so that we can now see if they are on track by looking at data that has been obtained between the time of the predictions and 2010.
New Oil Fields • There are known reserves off the west coast of the US and in the Arctic. • There is conflict about allowing drilling in the ocean, particularly after the incident in the Gulf in 2010.
What if the US citizens decided whether to drill in the oceans or transition to a more environmental sustainable society?
Our Choice • If a super majority of Americans wanted to drill, then we drill. • If those who want to drill are not a super majority, then we should take a more conservative approach to impacting our planet and begin our transition to a more sustainable society. • We will consider a super majority to be 66.7%.
Our Question • Does a super majority of adult Americans want to drill for oil in the ocean waters, in spite of the risks?
A Census • To know the absolute answer to this question would require a census – that is asking every single adult in the country (approximately 230 million people). • Since a census is expensive, time consuming and generally not possible, we will make a hypothesis about the opinions of people and then take a sample to test our hypothesis.
Our Hypotheses • H0: p = 0.667 • H1: p > 0.667 • p is the proportion of all adult Americans who think we should drill in marine waters. • A super majority is over 66.7%, thus the null hypothesis indicates there isn’t a super majority and the alternate indicates a super majority.
3 Methods • We will test these hypotheses using 3 different, but related methods. • Binomial distribution – gives exact results • Normal approximation to the binomial distribution – gives approximate results • Sampling distribution of sample proportions – gives approximate results.
Visualizing the Hypotheses H0: p = 0.667 H1: p > 0.667
Picture the Opinion of the Entire Adult US Population Use your imagination to picture 230 million black or green circles on this map, one for each adult’s opinion. drill don’t drill Image of US Map from http://www.thinkstockphotos.com/search/#us map/f=PIHV
The Sample • Since we can’t do a census, our next best alternative to understanding the population is to take a random sample. We are going to then have to use this sample as a way of determining which hypothesis to support.
Error • Because we are going to make a judgment about the entire population based on a sample, it is possible that we will make an error as a result of the data we randomly select. • If the data supports the alternate hypothesis, we could make a Type I Error. • If the data supports the null hypothesis, we could make a Type II Error. • We will not know if we make an error but there are consequences if we do.
Consequences of Errors • The consequence of a Type I error would be that we would drill for oil when we don’t have a super majority. • The consequence of a Type II error would be that we wouldn’t drill for oil when the super majority thinks we should.
Our Sample This is our sample, in the order in which the samples were taken. Black represents drill, green represents not drilling. What we have to decide is how to use this sample to determine which hypothesis to support. One way to use this sample is to count the number in favor of drilling (black) and the number opposed to drilling (green). Our sample has 16 in favor, 4 opposed. Disclaimer: Obviously, this is a very small sample. This sample size is being used to keep this demonstration reasonable.
Hypothesis Testing Theory • When testing hypotheses, we start with the assumption the null hypothesis is true. • We reject the null hypothesis only if we get data that is unlikely. That is, we get data that would be considered a rare event. • To determine what is and isn’t a rare event, we must first recognize that random samples do not look exactly like the population from which they were drawn.
The Null Distribution • Our objective is to create the null distribution. This distribution shows the complete set of possible outcomes and gives the probability of each of the outcomes. • Probability = This assumes that every outcome is equally likely, which in a simple random sample would be the case (theoretically).
The Starting Point • If we assume the null hypothesis is true, that is, we assume that exactly two thirds (0.667) of the population wants to drill and exactly one third (0.333) does not want to drill, and if we randomly select from this population, then the probability that we select someone who wants to drill is 0.667.
P(A or B)=P(A) + P(B) • When one selection is made from a population, the probability it has one of two mutually exclusive characteristics is found by adding the probabilities of each characteristic. • This rule is useful for understanding complements.
P(A or B)=P(A) + P(B) • Assuming everyone in the country has an opinion on this topic, then the probability we select someone who wants to drill or doesn’t want to drill = 1, which is a certainty. Therefore: • P(Drill or Don’t Drill)=P(Drill) + P(Don’t Drill) • 1=P(Drill) + P(Don’t Drill)
Complements • 1=P(Drill) + P(Don’t Drill) • With a little algebra, we see that P(Don’t Drill) = 1 – P(Drill). Therefore, if the probability of selecting someone who wants to drill is 0.667, the probability of selecting someone who doesn’t want to drill is 1- 0.667 = 0.333.
P(A and B) = P(A)P(B) • For independent events such as selecting people and asking their opinion about drilling, the probability of any specific sequence of responses is found by multiplying the probabilities of each individual response.
P(A and B) = P(A)P(B) • Thus, if we selected 2 people from the population, it is possible to get the following four combination of opinions. • These can be shown as P(B and B), P(B and G), P(G and B), P(G and G) however, this will be abbreviated by the removal of the word “and” to give: P(BB), P(BG), P(GB), P(GG)
P(A and B) = P(A)P(B) • Using the above rule we have: P(BB) = P(B)P(B) = 0.667• 0.667 = 0.445 P(BG) = P(B)P(G) = 0.667 • 0.333 = 0.222 P(GB) = P(G)P(B) = 0.333 • 0.667 = 0.222 P(GG) = P(G)P(G) = 0.333 • 0.333 = 0.111 Notice that the sum of all these probabilities is 1, since they are the complete set of possible outcomes for a sample size of 2.
Appling this to our sample • Remember that our sample was: This can be represented mathematically as: P(BBGBBBBGBBBBBGGBBBBB) = P(B)P(B)P(G)P(B)P(B)P(B)P(B)P(G)P(B)P(B)P(B)P(B)P(B)P(G)P(G)P(B)P(B)P(B)P(B)P(B) = (0.667)(0.667)(0.333)(0.667)(0.667)(0.667)(0.667)(0.333)(0.667)(0.667)(0.667)(0.667)(0.667)(0.333)(0.333)(0.667)(0.667)(0.667)(0.667)(0.667) = 0.0000189 Therefore, the probability of getting our exact sequences of drill and don’t drill opinions, assuming the null hypothesis is true is 0.0000189.
Applying this to our sample If the probability of this exact sequence is 0.0000189, because multiplication is commutative, does it seem reasonable that the probability of each of the following exact sequences is also 0.0000189?
Using Exponents The last sequence is a convenient way of representing 16 black and 4 green circles because we can use exponents to make our calculations faster. Thus we have: P(drill)16P(don’t drill)4 = (0.667)16(0.333)4 = 0.0000189
A shift in our thinking • When we take a sample, we don’t really care about the order in which the data are collected. What we want to know is the probability of getting a particular number of people who want to drill. In this example, we might want to know the probability that exactly 16 out of 20 people in the sample will want to drill.
Adding Probabilities • We now need to return to the rule for mutually exclusive events. • P(A or B) = P(A) + P(B) • Our use of this formula involves the different combinations of outcomes to the survey: Of course, there are many more arrangements (combinations) of 16 black and 4 green circles than are shown here.
Multiplication instead of addition • Since each combination has exactly the same probability (0.0000189) then instead of finding each combination and adding the probabilities of each, we could simply multiply that probability by the number of combinations. Combinations are found using Since our sample size is n = 20 and the number of people who want to drill is r = 16, then TI 83/84: 20 Math PRB #3 16 Enter
Contrast • Make sure you understand the difference between finding the probability of one particular sequence of outcomes and the number of people who want to drill. • The probability of one particular sequence such as = 0.0000189. • The probability of exactly 16 successes in a sample of size 20 with a probability as defined in the null hypothesis is 4845•0.0000189 = 0.0916.
Focus on what’s important • We care about the number of people who want to drill more than the order in which their opinion was recorded. • Recall that our objective is to determine the likelihood of particular outcomes. • For a sample of size 20, there are 21 possible outcomes for the number of people who want to drill. These possible outcomes are: 0,1,2,3,4,5,6,7,8,9,10,11,12,13,14,15,16,17,18,19,20
Binomial Distribution Formula • We found the probability of exactly 16 people who want to drill by multiplying the number of combinations times the probability of a specific combination. Formally, this is: Where n = sample size, r = number who want to drill, p = probability of selecting someone who wants to drill and q = probability of selecting someone who doesn’t want to drill. TI 83/84: 2nd Distr Binompdf(n,p,r): Example: Binompdf(20,0.667,16)
Binomial Distribution • If we apply the binomial distribution formula to each possible number of successes, we can create a binomial distribution.
Testing Our Hypotheses Review: The principle behind hypothesis testing is to assume the null hypothesis is true and then determine if selecting our data was a rare event. The probability of selecting our data or more extreme data is called the p-value. Since our hypotheses are H0: p = 0.667 H1: p > 0.667 The direction of our extreme is to the right because it is high values that would lead us to conclude the proportion is more than 0.667 and high values are to the right on a number line.
Testing Our Hypotheses • Rare events have small p-values. • A p-value is considered to be small enough to be regarded as a rare event if it is less than or equal to alpha, which is the probability of making a type I error. If p-value ≤ α, accept H1. The data are significant.
Testing Our Hypotheses • Let α=0.05. • Since our data was 16 people who wanted to drill, then we can find the probability of getting 16 or more by adding up the probabilities on the binomial distribution. Our p-value = 0.152. Since the p-value is greater than α, we conclude that it would not be a rare event to get 16 out of 20 people to support drilling if exactly 66.7% of the adult American population supports drilling, therefore the evidence from our sample supports the null hypothesis which indicates there is not a super majority.
Using the Calculator to Test a hypothesis using the binomial Distribution • Rather than creating an entire binomial distribution and adding up the probabilities for the data and more extreme values, we can use the binomcdf function on the calculator. Binomcdf always adds the probabilities to the left, so if the direction of the extreme is to the right, we need to use the complement rule, and also subtract one from our x value. That means the probability of getting 16 or more equals 1 minus the probability of getting 15 or less. • 1 – binomcdf(n,p,r-1) = 1 – binomcdf(20,0.667,15)=0.152
Using the Calculator to Test a hypothesis using the binomial Distribution • If the direction of the extreme had been to the left because of a < symbol in the alternate hypothesis, we would use: binomcdf(n,p,r) to get the p-value.
Summary • A binomial distribution includes all possible outcomes and their probabilities if the null hypothesis is true. Using this distribution allows us to find the exact p-value for our data and thereby determine if the data is rare enough to cause us to reject the null hypothesis.