Download
1 / 43
430 likes | 526 Views
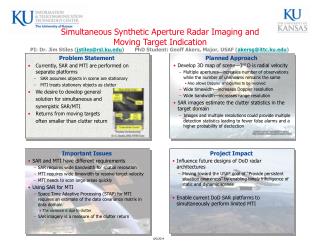
Humidity Estimates Using Simultaneous S- and K a -band Radar Measurements. Scott Ellis National Center for Atmospheric Research. Motivation: Humidity. Water vapor is an important variable for weather at many scales Convection Severe weather Convective initiation

E N D
Humidity Estimates Using Simultaneous S- and Ka-band Radar Measurements Scott Ellis National Center for Atmospheric Research
Motivation: Humidity • Water vapor is an important variable for weather at many scales • Convection • Severe weather • Convective initiation • PBL humidity difference of 1 g kg-1 can change CAPE from 0 to 600 J kg-1 – the difference between no storms and heavy rain (Crook 1996) • Numerical weather prediction and data assimilation • Quantitative precipitation estimation and forecasting • Hydrology in complex terrain • Tropical meteorology, e.g. the onset of the MJO
Motivation: Humidity • Water vapor is highly variable in space and time (Crook 1996, Weckwerth et al. 1999) • Operational soundings occur every 12 hours separated by ~ 300 km • Additional high temporal water vapor measurements have numerous applications • Water vapor estimates from scanning radar could give high temporal resolution (typically 5 to 10 minute update times)
Traditional radar cannot measure water vapor Microwaves are attenuated by water vapor Attenuation depends on watervaporquantity and radar wavelength Background Gaseous attenuation (dB km-1) Water vapor density (g m-3)
Water vapor could be estimated from gaseous attenuation measurements How to measure gaseous attenuation? Background
Background: S-PolKa • NCAR S-Pol radar upgraded with simultaneous S-band (10 cm) and Ka-band (0.8 cm) measurement capability (S-PolKa) • Matched 1 deg beam widths • Matched 150 m range gates S-band antenna Ka-band antenna • S-band is non-attenuating • Ka-band is heavily attenuating
Background: S-PolKa • NCAR S-Pol radar upgraded with simultaneous S-band (10 cm) and Ka-band (0.8 cm) measurement capability (S-PolKa) • Matched 1 deg beam widths • Matched 150 m range gates • S-band is non-attenuating • Ka-band is heavily attenuating • For Rayleigh scatterers the S and Ka-band reflectivity differences are due to liquid and gas attenuation at Ka-band Gaseous attenuation (dB km-1) Water vapor density (g m-3)
Objectives Path integrated water vapor profiles + Height + + + + Range Objectives • Estimate path-integrated humidity from dual-wavelength radar estimated gaseous attenuation • Combine several estimates to create a vertical profile
Humidity Estimate: Method • Obtain Ray Segment • Compute Ka-band Gaseous Attenuation (dB km-1) • Compute Path-integrated Humidity • Compute Layer-based Vertical Profile
Humidity Estimate: Obtain Ray Segment • Select small 2-D patches of cloud or precipitation echo (10 to 20 radar gates) • Each data patch results in one estimate of mean attenuation (dB km-1) and humidity (g m-3) S-band reflectivity (dBZ) Ka-band reflectivity (dBZ) Primary ray
Humidity Estimate: Obtain Ray Segment • Select small 2-D patches of cloud or precipitation echo (10 to 20 radar gates) • Each data patch results in one estimate of mean attenuation (dB km-1) and humidity (g m-3) S-band reflectivity (dBZ) Ka-band reflectivity (dBZ) Primary ray
Humidity Estimate: Obtain Ray Segment S-band reflectivity (dBZ) Ka-band reflectivity (dBZ)
Humidity Estimate: Obtain Ray Segment S-band reflectivity (dBZ) Ka-band reflectivity (dBZ)
Humidity Estimate: Obtain Ray Segment S-band reflectivity (dBZ) Ka-band reflectivity (dBZ) Secondary Ray
Humidity Estimate: Compute Attenuation • Compute mean gaseous attenuation (dB km-1) of ray segments of length L • Ag = (dBZS – dBZKa)/L = DZ/L
Humidity Method: Estimate Humidity • Microwave propagation model computes Ag for P, T and Humidity • Run Liebe (1987) model many times varying T, P and WV (g m-3) • Compute polynomial fit of WV to attenuation Results for RICO Water vapor density (g m-3) WV = 201.40A3 – 209.60A2 + 120.55A – 2.25 Where WV is water vapor density (g m-3) and A is gaseous attenuation (dB km-1)
Humidity Method: Estimate Humidity • Microwave propagation model computes Ag for P, T and Humidity • Run Liebe (1987) model many times varying T, P and WV (g m-3) • Compute polynomial fit of WV to attenuation WV = 116.62A3 – 162.02A2 + 118.71A – 0.94 Results for REFRACTT Results for RICO Water vapor density (g m-3) WV = 201.40A3 – 209.60A2 + 120.55A – 2.25 Where WV is water vapor density (g m-3) and A is gaseous attenuation (dB km-1)
Humidity Method: Creating Vertical Humidity Profile • Plot midpoint of ray segments • Layer-based Profile • Typical resolution 0.25 to 0.5 km + Height + + Range
Humidity Method: Error Sources • Ag = (dBZS – dBZKa)/L = DZ/L • Error in gaseous attenuation, and thus humidity estimates are a function of ray segment length • 1 g m-3 is between 5 and 10 percent error • Requires dBZ difference errors less than 0.5 dB and range > 15 km Humidity errors resulting from DZ errors of 0.5 and 1.0 dB as a function of L Ray segment length (km)
Humidity Method: Error Sources • Non Rayleigh scattering • Ground clutter • Point targets (birds aircraft) • Mie scattering at Ka-band (e.g. drops > 1 mm) • Bragg scattering at S-band • Ground clutter filter • Measurement noise • Attenuation by liquid • Calibration errors • Criteria designed to keep reflectivity difference errors < 0.5 dB
Averaging 10 gates is sufficient Addressing Sources of Error • Measurement error • The reflectivity variance is mitigated by averaging numerous range gates • How many is enough? • Can estimate measurement variance of Z at both wavelengths and thus the variance of the difference (Keeler and Passarelli 1990; Keeler and Ellis 2000)
Addressing Sources of Error • Inclusion of non-Rayleigh scatterers at S-band • Ground clutter • Point targets (aircraft, birds) • Bragg scatter • Reflections from fluctuations in humidity and temperature at a scale of 0.5l • Common near the turbulent edges of clouds • No Bragg echo detected at Ka-band • Require the S-band Z to be at least 5 dBZ. • Require the S-band Z to be at least 9 dB above the surrounding Bragg scatter
Addressing Sources of Error • Inclusion of non-Rayleigh scatterers at Ka-band • Drops > 1 mm • Estimate Dmax using S-band dual-polarimetric data and reject gates with Dmax > 1 mm • Liquid water attenuation contamination • Limit comparison data to 0.5 km into cloud echo • Compute a spatial correlation, r, between S- and Ka-band Z: Reject data with r < 0.7 • Radar calibration errors • Errors in humidity- attenuation relationship
+ + + Humidity Results: REFRACTT S-band reflectivity (dBZ) Ka-band reflectivity (dBZ) o + . KDNR
Humidity Results: REFRACTT + Over KDNR RMSD = 0.14 g m-3 Height (km) Layer-based estimate Sounding data Water vapor density (g m-3)
Humidity Results: REFRACTT + Over KDNR o North of S-PolKa Height (km) Layer-based estimate Sounding data Water vapor density (g m-3)
Humidity Results: REFRACTT Precipitable Water content from GPS S-Pol KDNR Courtesy of John Braun, NCAR
Humidity Results: REFRACTT + Over KDNR o North of S-PolKa Height (km) Layer-based estimate Surface station in moist air Sounding data Water vapor density (g m-3)
+ radar retrieval – primary ray x Radar retrieval – secondary ray Humidity Results: RICO 10 January, 2005 RMSD = 0.85 g m-3 Height (km) Sounding data Water vapor density (g m-3)
+ radar retrieval – primary ray x Radar retrieval – secondary ray Humidity Results: RICO 10 January, 2005 Layer-based estimate Mean of sounding data using layer-based estimate resolution Height (km) Sounding data Water vapor density (g m-3)
+ radar retrieval – primary ray x Radar retrieval – secondary ray Humidity Results: RICO 12 January, 2005 RMSD = 0.75 g m-3 Layer-based estimate Mean of sounding data using layer-based estimate resolution Height (km) Sounding data Water vapor density (g m-3)
Discussion: Humidity • The technique has recently been automated • Still testing algorithm thresholds • DYNAMO is first deployment • Layer based estimate not yet implemented – perhaps for DYNAMO
25 FRONT: Front Range Observing Network Testbed KCYS Pawnee CHILL S-PolKA Marshall site KFTG TDEN
Humidity Results: REFRACTT Low level humidity from refractive index measurements S-Pol KDNR
Various Radar Equations • g = antenna gain • = wavelength Pr = received power Pt = transmitted power q = vert beam width • = horiz beam width c = speed of light t = pulse width K = index of refraction L = attenuation losses z = reflectivity r = range D = diameter Ps = signal power Pn = noise power Mi = number independent pulses M = number of pulses sW = Spectrum width Td = dwell time Affective antenna area Radar equation for received power Reflectivity Variance of received power Number of independent samples
Various Equations Relative Bragg scatter reflectivity • M = number of pulses • N = number of range gates • = attenuation coefficient (dB km-1 (g m-3)-1) • = range gate spacing sW = Spectrum width ts = time between pulses SNR = signal to noise ratio
S-Pol Deployments Through Summer 2008 Boulder, CO 2006: REFRACTT 2006 Convective Initiation and water vapor Boulder, CO 2005: REFRACTT 2005 Convective Initiation and water vapor Denver, CO 1997: PROWS Convective rainfall estimation Boulder, CO 2004: WISP04 Winter Weather Idalia, CO: STEPS 2000 Severe convection and lightning Wichita, KS 1997: CASES 97 Watershed rainfall and land/surface West Port, WA 2001: IMPROVE Winter Storms Oklahoma Panhandle 2002: IHOP Water vapor and convective initiation Oregon 2001: IMPROVE II Orographic precipitation Milan Italy, 1999: MAP Orographic precipitation and flooding Melbourne, FL 1998: PRECIP98 Convective rainfall estimation S. Taiwan, 2008: TIMREX Monsoon and Mei-Yu Front flooding rain Mazatlan MX, 2004: NAME Orographic and Monsoon precipitation Barbuda W. Indies 2004: RICO Marine cumulus and warm rain Ji-Parana, Brazil 1999: TRMM-LBA Amazon wet season rainfall
Averaging 10 gates is sufficient Addressing Sources of Error • Measurement error • The reflectivity variance is mitigated by averaging radar gates in range and azimuth • How many is enough? • Can estimate measurement variance of Z at both wavelengths and thus the variance of the difference (Keeler and Passarelli 1990; Keeler and Ellis 2000)
Addressing Sources of Error • Inclusion of non-Rayleigh scatterers at S-band • Ground clutter • Point targets (aircraft, birds) • Bragg scatter • Reflections from fluctuations in humidity and temperature at a scale of 0.5l • Common near the turbulent edges of clouds • No Bragg echo detected at Ka-band • Require the S-band Z to be at least 9 dB above the surrounding Bragg scatter
Addressing Sources of Error • Inclusion of non-Rayleigh scatterers at Ka-band • Drops > 1 mm • Estimate Dmax using S-band dual-polarimetric data and reject gates with Dmax > 1 mm • Liquid water attenuation contamination • Limit comparison data to 0.5 km into cloud echo • Compute a spatial correlation, r, between S- and Ka-band Z: Reject data with r < 0.7 • Radar calibration errors • Errors in humidity- attenuation relationship
Ka-band extinction, scattering and absorption Example rain DSDs(Illingworth and Blackman 2002)