Download
1 / 1
10 likes | 91 Views
LAPS Users’ Workshop, 25-27 October 2010, Boulder, Colorado. Comparison of LAPS analyses with EUMETSAT products for the characterization of cloud cover and instability indices in Mediterranean tropical-like cyclones.

E N D
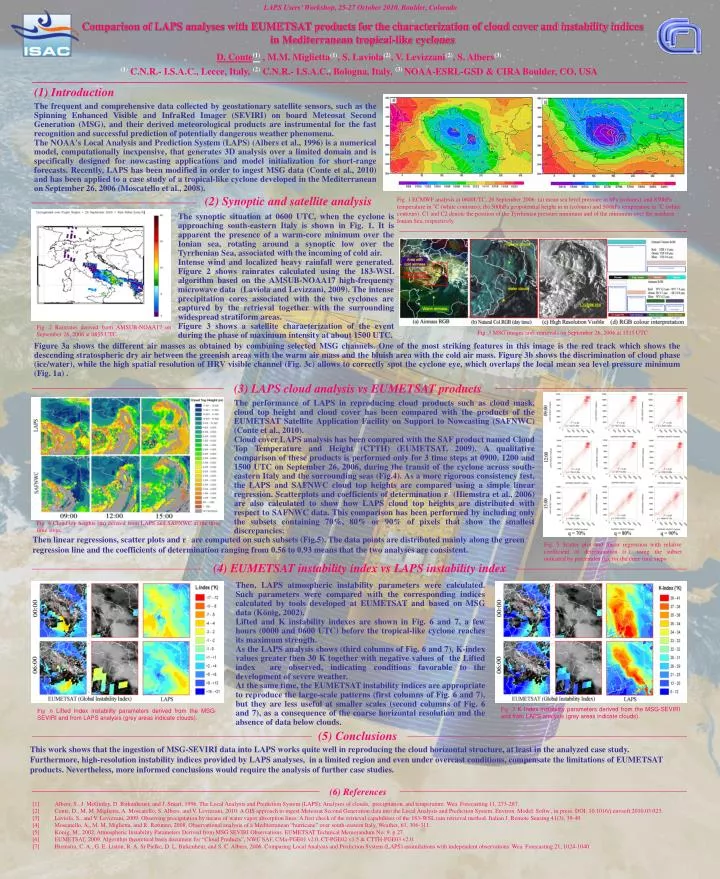
LAPS Users’ Workshop, 25-27 October 2010, Boulder, Colorado Comparison of LAPS analyses with EUMETSAT products for the characterization of cloud cover and instability indices in Mediterranean tropical-like cyclones D. Conte(1) , M.M. Miglietta(1), S. Laviola(2), V. Levizzani(2), S. Albers(3) (1) C.N.R.- I.S.A.C., Lecce, Italy, (2) C.N.R.- I.S.A.C., Bologna, Italy, (3) NOAA-ESRL-GSD & CIRA Boulder, CO, USA (1) Introduction The frequent and comprehensive data collected by geostationary satellite sensors, such as the Spinning Enhanced Visible and InfraRed Imager (SEVIRI) on board Meteosat Second Generation (MSG), and their derived meteorological products are instrumental for the fast recognition and successful prediction of potentially dangerous weather phenomena. The NOAA's Local Analysis and Prediction System (LAPS) (Albers et al., 1996) is a numerical model, computationally inexpensive, that generates 3D analysis over a limited domain and is specifically designed for nowcasting applications and model initialization for short-range forecasts. Recently, LAPS has been modified in order to ingest MSG data (Conte et al., 2010) and has been applied to a case study of a tropical-like cyclone developed in the Mediterranean on September 26, 2006 (Moscatello et al., 2008). (2) Synopticand satellite analysis Fig.1ECMWF analysis at 0600UTC, 26 September 2006: (a) mean sea level pressure in hPa (colours), and 850hPa temperature in °C (white contours); (b) 500hPa geopotential height in m (colours) and 500hPa temperature in °C (white contours). C1 and C2 denote the position of the Tyrrhenian pressure minimum and of the minimum over the northern Ionian Sea, respectively. The synoptic situation at 0600 UTC, when the cyclone is approaching south-eastern Italy is shown in Fig. 1. It is apparent the presence of a warm-core minimum over the Ionian sea, rotating around a synoptic low over the Tyrrhenian Sea, associated with the incoming of cold air. Intense wind and localized heavy rainfall were generated. Figure 2 shows rainrates calculated using the 183-WSL algorithm based on the AMSUB-NOAA17 high-frequency microwave data (Laviola and Levizzani, 2009). The intense precipitation cores associated with the two cyclones are captured by the retrieval together with the surrounding widespread stratiform areas. Figure 3 shows a satellite characterization of the event during the phase of maximum intensity at about 1500 UTC. Fig.2Rainrates derived from AMSUB-NOAA17 on September 26, 2006 at 0855 UTC. Fig.3 MSG images and retrievalson September 26, 2006 at 1515 UTC. Figure 3a shows the different air masses as obtained by combining selected MSG channels. One of the most striking features in this image is the red track which shows the descending stratospheric dry air between the greenish areas with the warm air mass and the bluish area with the cold air mass. Figure 3b shows the discrimination of cloud phase (ice/water), while the high spatial resolution of HRV visible channel (Fig. 3c) allows to correctly spot the cyclone eye, which overlaps the local mean sea level pressure minimum (Fig. 1a) . (3) LAPS cloud analysis vs EUMETSAT products The performance of LAPS in reproducing cloud products such as cloud mask, cloud top height and cloud cover has been compared with the products of the EUMETSAT Satellite Application Facility on Support to Nowcasting (SAFNWC) (Conte et al., 2010). Cloud cover LAPS analysis has been compared with the SAF product named Cloud Top Temperature and Height (CTTH) (EUMETSAT, 2009). A qualitative comparison of these products is performed only for 3 time steps at 0900, 1200 and 1500 UTC on September 26, 2006, during the transit of the cyclone across south-eastern Italy and the surrounding seas (Fig.4). As a more rigorous consistency test, the LAPS and SAFNWC cloud top heights are compared using a simple linear regression. Scatterplots and coefficients of determination r2 (Hiemstra et al., 2006) are also calculated to show how LAPS cloud top heights are distributed with respect to SAFNWC data. This comparison has been performed by including only the subsets containing 70%, 80% or 90% of pixels that showthe smallest discrepancies. Fig. 4 Cloud top heights (m) derived from LAPS and SAFNWC at the three time steps. Then linear regressions, scatter plots and r2 are computed on such subsets (Fig.5). The data points are distributed mainly along the green regression line and the coefficients of determination ranging from 0.56 to 0.93 means that the two analyses are consistent. Fig. 5 Scatter plot and linear regression with relative coefficient of determination (r2), using the subset indicated by percentiles (q), for the three time steps (4) EUMETSAT instability index vs LAPS instability index Then, LAPS atmospheric instability parameters were calculated. Such parameters were compared with the corresponding indices calculated by tools developed at EUMETSAT and based on MSG data (König, 2002). Lifted and K instability indexes are shown in Fig. 6 and 7, a few hours (0000 and 0600 UTC) before the tropical-like cyclone reaches its maximum strength. As the LAPS analysis shows (third columns of Fig. 6 and 7), K-index values greater then 30 K together with negative values of the Lifted index are observed, indicating conditions favorable to the development of severe weather. At the same time, the EUMETSAT instability indices are appropriate to reproduce the large-scale patterns (first columns of Fig. 6 and 7), but they are less useful at smaller scales (second columns of Fig. 6 and 7), as a consequence of the coarse horizontal resolution and the absence of data below clouds. Fig .7 K Index instability parameters derived from the MSG-SEVIRI and from LAPS analysis (grey areas indicate clouds). Fig .6 Lifted Index instability parameters derived from the MSG-SEVIRI and from LAPS analysis (grey areas indicate clouds). (5) Conclusions This work shows that the ingestion of MSG-SEVIRI data into LAPS works quite well in reproducing the cloud horizontal structure, at least in the analyzed case study. Furthermore, high-resolution instability indices provided by LAPS analyses, in a limited region and even under overcast conditions, compensate the limitations of EUMETSAT products. Nevertheless, more informed conclusions would require the analysis of further case studies. (6) References [1] Albers, S., J. McGinley, D. Birkenheuer, and J. Smart, 1996. The Local Analysis and Prediction System (LAPS): Analyses of clouds, precipitation, and temperature. Wea. Forecasting 11, 273-287. [2] Conte, D., M. M. Miglietta, A. Moscatello, S. Albers, and V. Levizzani, 2010: A GIS approach to ingest Meteosat Second Generation data into the Local Analysis and Prediction System. Environ. Model. Softw., in press. DOI: 10.1016/j.envsoft.2010.03.023. [3] Laviola, S., and V. Levizzani, 2009: Observing precipitation by means of water vapor absorption lines: A first check of the retrieval capabilities of the 183-WSL rain retrieval method. Italian J. Remote Sensing 41(3), 39-49. [4] Moscatello, A., M. M. Miglietta, and R. Rotunno, 2008, Observational analysis of a Mediterranean “hurricane” over south-eastern Italy, Weather, 63, 306-311. [5] König, M., 2002, Atmospheric Instability Parameters Derived from MSG SEVIRI Observations. EUMETSAT Technical Memorandum No. 9. p 27. [6] EUMETSAT, 2009. Algorithm theoretical basis document for “Cloud Products”, NWC SAF, CMa-PGE01 v2.0, CT-PGE02 v1.5 & CTTH-PGE03 v2.0. [7] Hiemstra, C. A., G. E. Liston, R. A. Sr Pielke, D. L. Birkenheur, and S. C. Albers, 2006. Comparing Local Analysis and Prediction System (LAPS) assimilations with independent observations. Wea. Forecasting 21, 1024-1040.