Download
1 / 21
220 likes | 390 Views
Macroalgae as an Indicator of Estuarine Condition. Eric Milbrandt, Ph.D. Marine Laboratory Sanibel-Captiva Conservation Foundation (SCCF) Caloosahatchee Science Workshop 2013 Florida Gulf Coast University 11/20/13. Background.

E N D
Macroalgae as an Indicator of Estuarine Condition Eric Milbrandt, Ph.D. Marine Laboratory Sanibel-Captiva Conservation Foundation (SCCF) Caloosahatchee Science Workshop 2013 Florida Gulf Coast University 11/20/13
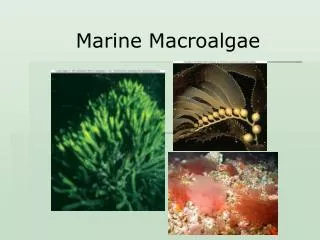
Background • “Unattached” macroalgae is a common component of seagrass communities • Provides food and refuge for seagrass fauna (Virnstein and Carbonara1985, Fry 1984) • Has high levels of productivity (Williams 1977) • Contributes to the DOC pool through decomposition (Zieman1984) • High levels of nutrition, little refractory carbon (Hermann 1994) • Extensive drift algal abundances decrease the amount of available light in seagrass (William Cowper 1978, Montfrans 1984) • Drift algal blooms decrease seagrass vertical shoot density in the presence of urchins (Macia 1999) 4/27/10, trawls in San Carlos Bay 12/6/10, near causeway
Occurrences of “Drift Algae” • Initially attached to substrata such as seagrass shells rocks or sponges and breaks loose • Usually non-calcified fleshy or filamentous, reproduce vegetatively (Norton & Matheison1983) 12/15/12 Sanibel Lighthouse • Large accumulations after storms (Williams Cowper 1978) in Biscayne Bay (Josselyn 1977) • “Tumbling” in sparse seagrass in the IRL (Virnstein 1985), up to 0.5 km/day (Holmquest 1994) 10/19/13 Knapp’s Point after TS Karen
Drivers • Eutrophication-Algal biomass linked to N-loading • Waquoit Bay Massachusetts, Gracilariatikvahae(Valiela 1992) • Bermuda, Caulerpaprolifera(Lapointe 1989) • French Mediterranian coast, Ulvalactuca(Maze et al 1993) • Sanibel Island,Hypnea, SoleriaDawes (2003)
Caloosahatchee versus other estuaries 800 200 Biomass g DW m-2 Valiela (1997) Dixon 2008 TN = 1,873 MT (1,873 X 103 kg) yr-1 Caloosahatchee Biomass 100-200 g m-2 not uncommon What is the tipping point?
Fragmentation Hypneafragment survival data support the proliferation that was observed in late 2006, early 2007 (Vermeij et al. 2009) Sanibel; 02/21/07
Common Species • Significant differences in species composition and abundance at inshore vs. offshore locations
OFFSHORE INSHORE
OFFSHORE INSHORE 2008-2010. Each point represents the mean biomass (n=20) Inshore CES11, near Fishermans Key; offshore is GOM12, 5 miles west of Redfish pass.
Aldridge and Trimmer (2005) Half saturation constants for green macroalgae (NO3) 0.3 mg/L N. In: Anderson and Conley (2005) Ambrose EPA WASP models use 0.1 mg/L N half saturation for macroalgal external N uptake. Sufficient nutrients in the lower Caloosahatchee Estuary to support year round macroalagal growth.
Driver-Irradiance • Higher irradiances inshore from Dec. to May after N-loading. • Offshore, high irradiances coincident with flows and loading (SCCF, Ladyfinger Lakes 4/1/13)
Driver-herbivory • Lack of inshore urchins?
Top Down Control • Evidence from panhandle that grazer abundance can control macroalgal proliferations (Heck and Valentine) • Results from one offshore location with abundant grazers suggests some top down control at GOM04 (Coen et al. 2010) but low salinities prevent larval settlement in San Carlos Bay
Driver-Roughness • Benthic habitat maps (G. Foster 2010)
Driver-Temperature • Temperature had a significant affect on photosynthesis and daily growth, salinity did not (Brown, USF M.S. thesis 2001) • Temperatures can be several degrees warmer in shallow sites (SCCF RECON data), growth rates from the field are needed.
Indicator Considerations • Biomass and percent cover (Scanlan 2009 framework), N-loading, residence time vs. growth rates • Inshore and offshore locations needed to capture large (extreme) interannual differences in S79 flows • Improve CHNEP mapping by determining accuracy of SAV maps (patchy/continuous, with/without macroalgae) • Improves SAV indicators by providing additional drivers (space competition) and ecosystem services • Improves beach condition indicators (red tide, bacteria) • Methods and equipment proven and tested in the 2010 study
SCCF Current efforts • Growth and N uptake rates (ammonia, NOX, TN) of local species • Measure growth rates (or mortality rates) of beach collected drift algae • Quantify biomass and percent cover from a 4 shore-side locations • Develop a key to common species in SW Florida • Workshop with FDEP and others to teach the use of the keys to identify to macroalgae to Genus and improve transect monitoring
Acknowledgements Drs. Loh, Parsons, Everham, A.J. Martignette, Jeff Siwicke, Brad Klement, Keleigh Provost, Mark Thompson, Drs. Greg Foster, Ray Grizzle Funding Partners: James Evans, City of Sanibel Steve Boutelle, Lee County, WCIND Rob Loflin, City of Sanibel Mike Campbell, Lee County