Correlation Significance Calculations using Numerical Integration
150 likes | 166 Views
Learn about the calculation of correlation significance using numerical integration methods, including the t-distribution and its implications for statistical analysis. Understand the key concepts and formulas involved in determining the significance of correlations.

Correlation Significance Calculations using Numerical Integration
E N D
Presentation Transcript
Correlation Significance Calculations using Numerical Integration
Review: Correlation • Value is +1 in the case of a (perfectly) increasing linear relationship • −1 in the case of a (perfectly) decreasing linear relationship • Some value in-between in all other cases • Indicates the degree of linear dependence between the variables • The closer the coefficient is to either −1 or 1, the stronger the correlation between the variables • r > 0.7 is considered “good” for PSP planning purposes SE-280Dr. Mark L. Hornick
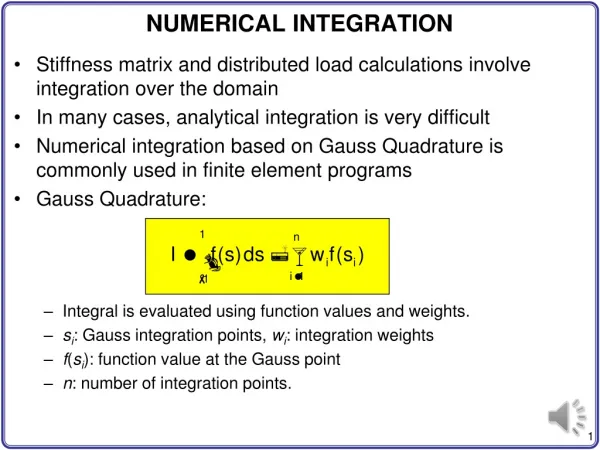
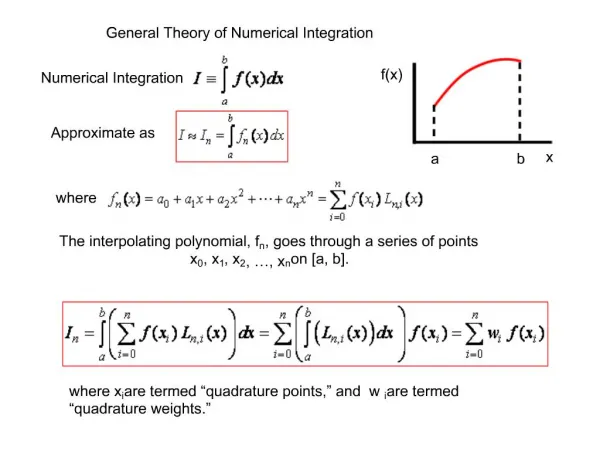
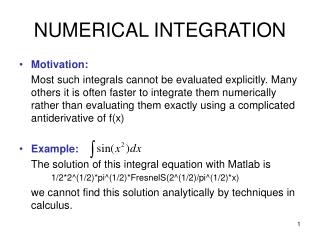
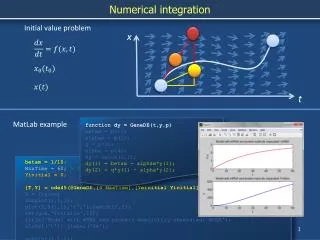
In the PSP, definite integrals of the t-distribution are used to calculate the significance of a correlation and the prediction interval of an estimate. Requirement: • Integrate an arbitrary f(x) from a to b The problem is that there is no (simple) closed-form solution for the integral of the t-distribution function. SE-280Dr. Mark L. Hornick
Distributions are important statistical functions that we often need to integrate. Normal Distribution: The probability density function for a large sample size Its integral represents a cumulative probability over some range (more on that in a moment). SE-280Dr. Mark L. Hornick
The t distribution is another type of probability density function we often need to integrate. d = degrees of freedom As d increases, thet-distribution approaches the normal distribution In the PSP, the t distribution is used to calculate the significance of a correlation and the prediction interval of an estimate. SE-280Dr. Mark L. Hornick
The t-distribution function d = number of degrees of freedom
The gamma function SE-280Dr. Mark L. Hornick
The gamma function is defined recursively: Base cases to terminate recursion In the t distribution, some gamma arguments are multiples of one-half!
0 x We often calculate the definite integral of the t-distribution. Integral value = p x t SE-280Dr. Mark L. Hornick
Next, calculate the t-distribution area in the "tails" outside (-t,t) with n-(m+1) degrees of freedom. where "p" is the area (integral) from 0 to +t. In cycle 6, you will be required to calculate the significance of a correlation. • First, calculate an integration limit (t) for use with the t distribution. • rx,y correlation • n number of historical data points • m number of independent (x) variables A tail area of < 0.05 indicates high significance, while a value > 0.2 suggests the relationship is due to chance. SE-280Dr. Mark L. Hornick
t Integration issues Problem: how do we integrate from -? x SE-280Dr. Mark L. Hornick
Integrating to (+) N is some large value such that f(N)0 x t SE-280Dr. Mark L. Hornick
Integrating to (-) x -t SE-280Dr. Mark L. Hornick
Summary of significance calculation Where n=# of data values,m=# of independent variables Where d=# degress of freedom, And d = n - (m+1) SE-280Dr. Mark L. Hornick
Here are some additional notes on Cycle 6. To calculate significance, you need to integrate only the t distribution • Evaluating the t distribution requires you to evaluate the gamma function, which is a recursive function. Some defects (e.g., off-by-one loop errors) can result in very small discrepancies in the calculated values – don't be fooled!