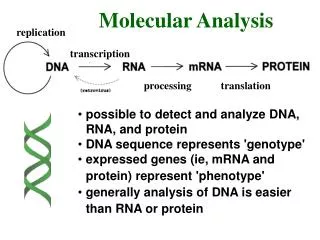
The Formula for ß-Cell Mass: Mitogenesis + Size + Neogenesis - Apoptosis = Growth
This article explores the factors that contribute to the growth or decline of ß-cell mass, including replication, neoformation, apoptosis, and various signaling pathways. It also discusses the pathogenesis of obesity-linked type-2 diabetes and the balance between ß-cell mass and peripheral insulin resistance.

The Formula for ß-Cell Mass: Mitogenesis + Size + Neogenesis - Apoptosis = Growth
E N D
Presentation Transcript
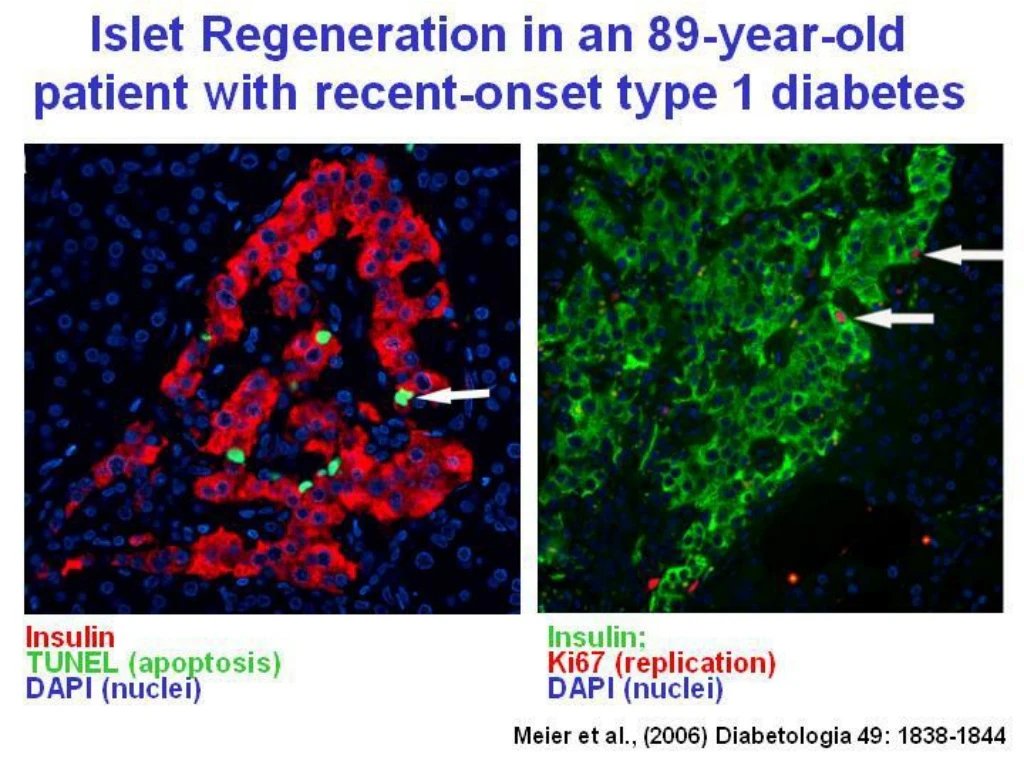
Replication Neoformation Apoptosis b-cell mass
IGF-1 P PDK1 P P P P P P P P PIP3 PIP3 PI (P) PH pY pY PH PTB PKCz PI3’K pY P85 PKB (Akt) p110 pY P mTOR pY I R S 2 GSK3 pY Grb2 mSOS pY Foxo-1 Mdm2 ß-Catenin pY Crk Ras GTP BAD pY p70S6K P Procaspase-9 Nck Raf-1 pY 4E-BP P CREB Cyclin-D Shp-2 p53 P MEK Fyn Protein Synthesis Erk-1/-2 P p21CIP CELL SIZE p90RSK P IGF-1 Induced Activation of IRS-2 Signaling in ß-cells IGF-1 Receptor ß-Cell Plasma Membrane CELL SIZE MITOGENESIS ANTI-APOPTOTIC DIFFERENTIATION ß-Cell Nucleus Chris Rhodes Ph.D. PNRI, Seattle, WA.
THE FORMULA FOR ß-CELL MASS - (Mitogenesis + Size + Neogenesis) - Apoptosis = Growth Increased ß-mass (i.e. compensation for insulin resistance): Decreased ß-mass (i.e. Type-2 diabetes): (Mitogenesis + Size + Neogenesis) > Apoptosis Apoptosis > (Mitogenesis + Size + Neogenesis) Chris Rhodes Ph.D. PNRI, Seattle, WA.
Glucose Intolerant Type-2 Diabetes Normal Adaptation Fasting Plasma Glucose 20 Fasting Glucose (mM/L) 10 0 Fasting Serum Insulin 400 Fasting Insulin (pmol/L) 200 The Pathogenesis of Obesity-linked Type-2 Diabetes [TIMM (2002) 8: 375-384] 0 Circulating FFA 1000 Plasma FFA ( µmol/L) 500 0 Pancreatic ß-Cell Mass 150 ß-Cell Mass (% change) 100 50 Islet Amyloid Deposit 5 2.5 Amyloid Deposit (% Pancreatic Area) 0 INCREASING AGE AND/0R DEGREE OF OBESITY (increasing peripheral insulin resistance) Chris Rhodes Ph.D. PNRI, Seattle, WA.
Non-Diabetic State Diabetic State ß-CELL MASS & FUNCTION PERIPHERAL INSULIN RESISTANCE ß-CELL MASS & FUNCTION PERIPHERAL INSULIN RESISTANCE Type-2 Diabetes - A Question of Balance - Chris Rhodes Ph.D. PNRI, Seattle, WA.
Lineage relationships during pancreatic development Glucagon Insulin Duodenum Endocrine precursors ? Endodermal precursor Pancreatic precursor Ductal Liver Exocrine precursor Exocrine Time Jensen and Jensen, 2002.
Ca2+ Voltage sens. Ca2+ Channel K+ Secretion K+/ATP-Channel PLC Glucose Ca2+ Glut-2 PKC + Ca2+ DAG + Depolarization 1,4,5-Ins-P3 Exocytosis Glucokinase Translation Ca2+ sensitization and release from intracellular stores Glu-6P ATP Granule form. Processing Glycolysis Splicing Stimulus–secretion coupling in the pancreatic b-cell J. Jensen NeuroD Pax6 Transcription PDX1 E2A INSULIN
Human therapeutic cloning. In order to obtain self-derived stem cells, adult cell nuclei are transferred to human oocytes, obtained as excess material from in-vitro fertilization. This procedure was used to create the sheep “Dolly”, and is at present highly controversial, and ethically debated, as the resulting blastula from the procedure could be transferred to a human foster mother, and give rise to a complete human being. Figure reproduced by permission from Solter et al. ScienceMag.
Cell intrinsic factors in pancreatic development. Amylase, CPA, trypsin Exocrine cells p48 Exocrine precursors Duct cells? remaining epithelial Precursors? intercalated duct/centroacinar cells? HNF1a PDX1 Nkx2.2 Nkx6.1 vHNF1 HNF4 HB9 Pancreas precursors HNF3b HNF6 Pancreas/ Duodenal precursors Pancreas precursors, Endocrine patterned Endodermal cells Ngn3 Notch1 HES1 Pro-endocrine cells Pancreas precursors, Differentiation suppressed. NeuroD ISL1 Pax6 Endocrine cells - Pax4 + Pax4 b-cell precursors Non-b-cells - PDX1 - Nkx2.2 PDX1 Nkx2.2 Nkx6.2 Brn4 Nkx6.1 Glucagon Insulin J. Jensen, 2002 a-cells b-cells
Endocrine tumor cells Expansion Modification Islets, Xeno Transplantable b-cells ES-cells, Allo Isolation, heavy immunosuppresion Expansion Differentiation Modification Adult b-cells, Allo ES-cells, self Isolation Expansion? Therapeutic cloning Expansion Differentiation Adult b-cells, Auto EG-cells Expansion Differentiation Isolation Expansion Only for NIDDM Liver GIP cells Trans differentiation Trans differentiation Differentiation Differentiation Pancreatic Stem Cells, Adult, Auto. Pancreatic Stem Cells Embryonic, Allo.
Extrapancreatic insulin-producing cells in multiple organs in diabetesKojima et al. PNAS 2004; 101:2458-2463 • Proinsulin mRNA and proinsulin protein induced with multiple forms of hyperglycemia in marrow derived CD45+ murine cells (in liver, adipose tissue, spleen, bone marrow and thymus[some acinar pancreas but not remnant islets]) STZ rat and mice; ob/ob mice/IP glucose X 3 days • Transgenic GFP driven by mouse insulin promoter gave complete concordance with presence proinsulin • Bone marrow transplantation experiments (bta galactosidase postive cells)indicated bone marrow derivation-Post glucose injections 30% of bone marrow cells positive for proinsulin and 75% of proinsulin positive cells beta galactosidase positive. • Proinsulin and somatostatin protein in same cells of liver of glucose injected mice.