Download
1 / 42
420 likes | 541 Views
This session focuses on the concepts of data distributions, visual representation using histograms, and numerical summaries in statistics. Key discussions will revolve around the importance of binwidth in histograms, time plots, and how to effectively analyze data by understanding mean and median, their differences, and the impact of outliers. We will explore methods for data collection using coins, and conclude with practical Excel applications for calculating statistical measures like variance and standard deviation. Engage in group experiments and explore data visualization techniques to deepen your statistical understanding.

E N D
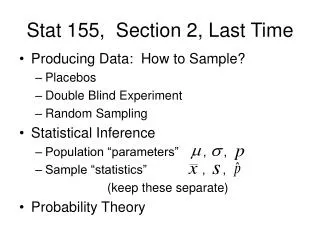
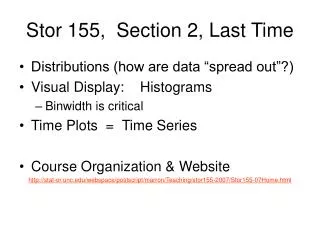
Stor 155, Section 2, Last Time • Distributions (how are data “spread out”?) • Visual Display: Histograms • Binwidth is critical • Time Plots = Time Series • Course Organization & Website http://stat-or.unc.edu/webspace/postscript/marron/Teaching/stor155-2007/Stor155-07Home.html
Reading In Textbook Approximate Reading for Today’s Material: Pages 40-55 Approximate Reading for Next Class: Pages 64-83
And now for something completely different Is this class too “monotone”? • Easier to understand? • Calm environment enhances learning? • Or does it induce somnolence? What is “somnolence”? Google definition: Sleepiness, a condition of semiconsciousness approaching coma.
And now for something completely different An experiment: • Pull out any coins you have with you • How many of you have: • >= 1 penny? • >= 1 nickel? • >= 1 dime? • >= 1 quarter? • Choose most frequent denomination
And now for something completely different Collect data (into Spreadsheet): • Years stamped on coins (chosen denomination) • Many as person has • Enter into spreadsheet • Look at “distribution” using histogram
And now for something completely different • Predicted Answer • From Text Book, Problem 1.32 • Distribution is Left Skewed • Works out as predicted? • Why? • Note: most skewed dist’ns seem to be: Right Skewed
Exploratory Data Analysis 4 Numerical Summaries of Quant. Variables: Idea: Summarize distributional information (“center”, “spread”, “skewed”) In Text, Sec. 1.2 for data (subscripts allow “indexing numbers” in list)
Numerical Summaries • “Centers” (note there are several) • “Mean” = Average = • Greek letter “Sigma”, for “sum” In EXCEL, use “AVERAGE” function
Numerical Summaries of Center • “Median” = Value in middle (of sorted list) Unsorted E.g: Sorted E.g: 3 0 1 1 27 “in middle”? (no) 2 better “middle”! 2 3 0 27 EXCEL: use function “MEDIAN”
Difference Betw’n Mean & Median Symmetric Distribution: Essentially no difference Right Skewed Distribution: 50% area 50% area M bigger since “feels tails more strongly”
Difference Betw’n Mean & Median Outliers (unusual values): Simple Web Example: http://www.stat.sc.edu/~west/applets/box.html • Mean feels outliers much more strongly • Leaves “range of most of data” • Good notion of “center”? (perhaps not) • Median affected very minimally • Robustness Terminology: Median is “resistant to the effect of outliers”
Difference Betw’n Mean & Median A richer web example: Publisher’s Web Site: Statistical Applets: Mean & Median • For Symmetric distributions: • Both are same • Add an outlier: • Mean feels it much more strongly • Implication for “bad data”: can be very bad • Two Clusters: • Median jumps more quickly • Mean more stable (better?)
Computation using Excel Some Toy Examples: http://stat-or.unc.edu/webspace/postscript/marron/Teaching/stor155-2007/Stor155Eg3Done.xls • Compute Using Excel Functions • Mean feels location of data on number line • Median feels location of data in sorted list • Median breaks tie by averaging center points
Numerical Centerpoint HW HW: 1.46 a, 1.47, 1.49 • Use EXCEL
And now for something completely different Check out this small quick movie clip:
And now for something completely different Suggestions for other things to show here are very welcome…. • Movie Clips… • Music… • Jokes… • Cartoons… • …
Numerical Summaries (cont.) • “Spreads” (again there are several) 1. Range = biggest - smallest range Problems: • Feels only “outliers” • Not “bulk of data” • Very non-resistant to outliers
Numerical Summaries of Spread • Variance = = “average squared distance to “ EXCEL: VAR Drawback: units are wrong e. g. For in feet is in square feet
Numerical Summaries of Spread • Standard Deviation EXCEL: STDEV • Scale is right • But not resistant to outliers • Will use quite a lot later (for reasons described later)
Interactive View of S. D. Interesting web example (manipulate histogram): http://www.ruf.rice.edu/~lane/stat_sim/descriptive/index.html • Note SD range centered at mean • Can put SD “right near middle” (densely packed data) • Can put SD at “edges of data” (U shaped data) • Can put SD “outside of data” (big spike + outlier) • But generally “sensible measure of spread”
Variance – S. D. HW C3: For the data set in 1.46 (i.e. 1.37), find the: • Variance (1620) • Standard Deviation (40.2) • Use EXCEL
Numerical Summaries of Spread • Interquartile Range = IQR Based on “quartiles”, Q1 and Q3 (idea: shows where are 25% & 75% “through the data”) 25% 25% 25% 25% Q1 Q2 = median Q3 IQR = Q3 – Q1
Quartiles Example Revisit Hidalgo Stamp Thickness example: http://stat-or.unc.edu/webspace/postscript/marron/Teaching/stor155-2007/Stor155Eg6Done.xls Right skewness gives: • Median < Mean (mean “feels farther points more strongly”) • Q1 near median • Q3 quite far (makes sense from histogram)
Quartiles Example A look under the hood: http://stat-or.unc.edu/webspace/postscript/marron/Teaching/stor155-2007/Stor155Eg6Raw.xls • Can compute as separate functions for each • Or use: Tools Data Analysis Descriptive Stats • Which gives many other measures as well • Use “k-th largest & smallest” to get quartiles
5 Number Summary • Minimum • Q1 - 1st Quartile • Median • Q3 - 3rd Quartile • Maximum Summarize Information About: • Center - from 3 • Spread - from 2 & 4 (maybe 1 & 5) • Skewness - from 2, 3 & 4 • Outliers - from 1 & 5
5 Number Summary How to Compute? http://stat-or.unc.edu/webspace/postscript/marron/Teaching/stor155-2007/Stor155Eg6Done.xls • EXCEL function QUARTILE • “One stop shopping” • IQR seems to need explicit calculation
Rule for Defining “Outliers” Caution: There are many of these Textbook version: Above Q3 + 1.5 * IQR Below Q1 – 1.5 * IQR For stamps data: http://stat-or.unc.edu/webspace/postscript/marron/Teaching/stor155-2007/Stor155Eg6Done.xls • No outliers at “low end” • Some at “high end”
Box Plot • Additional Visual Display Device • Again legacy from pencil & paper days • Not supported in EXCEL • So we won’t do • Main use: comparing populations • Example: Figure from text
Box Plot • Main use: comparing populations • Example: Figure from text • Want to do this? Find better software package than Excel
And now for something completely different Recall Distribution of majors of students in this course:
And now for something completely different How about a business manager joke? How many managers does it take to replace a light bulb?
And now for something completely different How about a business manager joke? How many managers does it take to replace a light bulb? Two. One to find out if it needs changing, and one to tell an employee to change it. Source: http://www.joblatino.com/jokes/managers.html
Linear Transformations Idea: What happens to data & summaries, when data are: “shifted and scaled” i.e. “panned and zoomed” Math: Scaled by a Shifted by b
Linear Transformations Effect on linear summaries: • Centerpoints, and “follow data”: . • Spreads, and “feel scale, not shift”: .
Most Useful Linear Transfo. “Standardization” Goal: put data sets on “common scale” Approach: • Subtract Mean , to “center at 0” • Divide by S.D. , to “give common SD = 1”
Standardization Result is called “z-score”: Note that Thus is interpreted as: “number of SDs from the mean”
Standardization Example Next time: work in Excel command: STANDARDIZE
Standardization Example Buffalo Snowfall Data: http://stat-or.unc.edu/webspace/postscript/marron/Teaching/stor155-2007/Stor155Eg7Done.xls • Standardized data have same (EXCEL default) histogram shape as raw data. (Since axes and bin edges just follow the transformation) • i.e. “shape” doesn’t depend on “scaling”
Standardization Example A look under the hood: http://stat-or.unc.edu/webspace/postscript/marron/Teaching/stor155-2007/Stor155Eg7Raw.xls Compute AVERAGE and SD • Standardize by: • Create Formula in cell B2 • Drag downwards • Keep Mean and SD cells fixed using $s 3. Check stand’d data have mean 0 & SD 1 note that “8.247E-16 = 0”
Standardization HW C4: For data in 1.17, use EXCEL to: a. Give the list of standardized scores b. Give the Z-score for: (i) the mean (0) (ii) the median (-0.223) (iii) the smallest (-1.21) (iv) the largest (2.77) 1.59a, 1.73