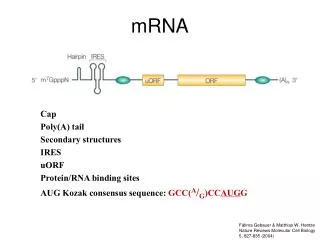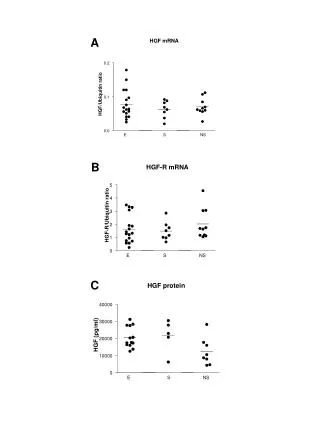
mRNA Quantification
mRNA Quantification. Real-time PCR. To accurately quantify starting amounts of nucleic acid during the PCR reaction without the need for post-PCR analyses. A fluorescent reporter is used to monitor the PCR reaction as it occurs; the reporter can be of a nonspecific or specific nature.

mRNA Quantification
E N D
Presentation Transcript
Real-time PCR • To accurately quantify starting amounts of nucleic acid during the PCR reaction without the need for post-PCR analyses. • A fluorescent reporter is used to monitor the PCR reaction as it occurs; the reporter can be of a nonspecific or specific nature. • The fluorescence of the reporter molecule increases as products accumulate with each successive round of amplification.
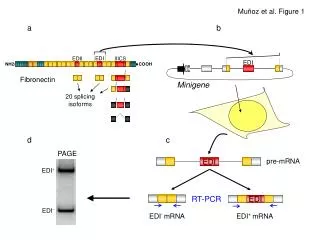
RT-PCR • Reverse transcription + Polymerase chain reaction • mRNA quantification
Threshold Cycle (Ct) • In the early cycles of amplification, the change in fluorescence of the reporter is usually undetectable, but at some point during amplification, the accumulation of product results in a measurable change in the fluorescence of the reaction mixture. • The point at which the fluorescence rises appreciably above background has been called the threshold cycle.
An Example DCt=log2(fold difference) 3.322=log210 1/10 serial dilution Well Ct B3 10.2 B4 13.6 B5 16.7 B6 20.9
SYBR Green I dsDNA에 결합되지 않은 dye는 아주 약한 형광을 내지만, 컴퓨터 분석과정에서 이러한 결합되지 않은 dye에 의한 형광값(background)은 충분히 제거할 수 있다. Primer를 넣어서 annealing 한 후, 몇몇 dye 분자들이 dsDNA와 결합한다. Dye가 dsDNA에 결합함으로, excitation 후 극격한 형광이 발산한다. DNA가 증폭 되는 동안, dye 분자가 새로이 합성되는 DNA 가닥에 결합한다. 증가되는 형광값을 real-time으로 볼 수 있다.
2nd experiment 이것도, Ct값이 좀 커서.. Unreliable 하다
33.35 2.7 22.7=6.50 30.65 25.2 3.4 23.4=10.56 0.7 20.7=1.62 23.5 21.8 21.1 2.1 22.1=4.29 21.4 1.9 21.9=3.73 19.5
2nd experiment 기울기가.. 좀 크다. - 4 정도
이것도 Ct값이 좀 커서.. Unreliable 하다 30.3 2.8 22.8=6.96 차이가 좀 크긴 하네.. 거의 같게 나와야 하는데 27.5 0.7 20.7=1.62 26.8
30.3 1.8 21.8=3.48 0.5 20.5=1.41 28.5 28 27.5 1.65 21.65=3.14 25.85 25.2 0.65 20.65=1.57
Slope of 2.33 means the … 농도에 따른 경향은 일정한데, 그 slope이 너무 작다. 이론적으로는 3.322가 나와야 한다.
30.45 4 24=16 0.55 20.55=1.464 27.0 26.45
26.45 0.7 20.7=1.62 25.75 0.9 20.9=1.87 24.85
2.95 22.95=7.73 26.45 25.75 1.8 21.65=3.48 - 0.5 2-0.5=0.62 24.65 23.95 23.6 - 0.1 2-0.1=0.933 23.5
Discussion • Repetitive experiments • mRNA concentration dependency • t-values, are they still valid?