Download
1 / 13
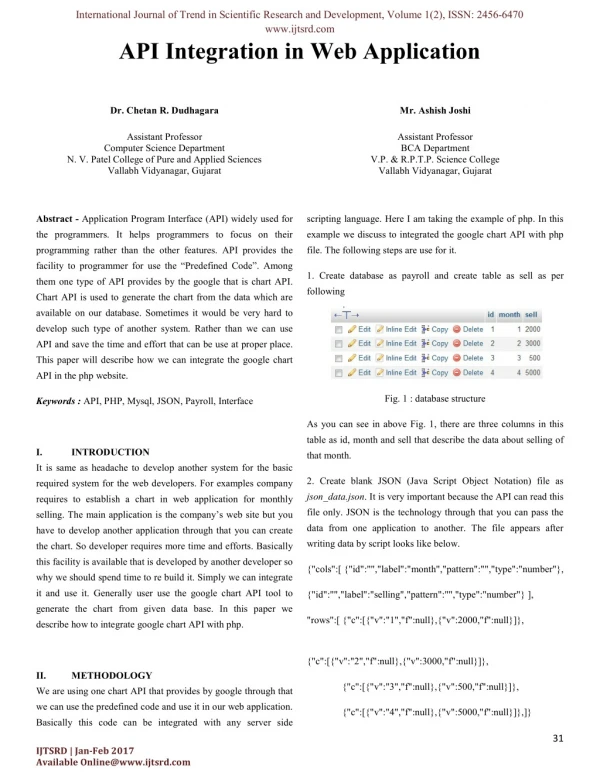
130 likes | 296 Views
Px-Web API use in INSTAT. Table of Contents. About PX-Web API PX-Web API use in INSTAT About Data Visualization Project Future plans. About PX-Web API. PxWeb API A programmatic way to access px-web database

E N D
Table of Contents About PX-Web API PX-Web API use in INSTAT About Data Visualization Project Future plans
About PX-Web API • PxWeb API • A programmatic way to access px-web database • GET Request: metadata about databases, levels, tables, contents and variables of a table • Returns a json format of the metadata • POST Request: post a query for retrieving data from a table • Returns a specified format of the filtered table (json, xml, px, csv.)
About PX-Web API • GET Request: API/LANGUAGE/DATABASE-ID/<LEVELS>/TABLE-ID • http://instat.gov.al:8080/api/al/DST/LSMS/LSMS01 • JSON metadata response • POST Request: Posting a json formatted request to the above url will return a response with the data filtered according to the posted query. • User specified format response
PX-Web API GET request Example resoponse of the GET request “/api/en” [{"dbid":"DST","text":"Statistical database"}] Example response of the GET request “/api/en/DST/ND” [{"id":"ND0001","type":"t","text":"Constructions by their type- Riconstructions 2004-1 - 2012-4"}, {"id":"ND0002","type":"t","text":"Dwelling by prefecture by prefectures according to construction permits 2005 - 2011"}, {"id":"ND0003","type":"t","text":"Number and square meter of building permits issue for new buildings 2004-1 - 2012-4"}, {"id":"ND0004","type":"t","text":"Dwelling by district according to construction permits 2005 - 2011"}, {"id":"ND0005","type":"t","text":"Value of building permits issued by clients for buildings and civil engineering works 1999 - 2011"}, {"id":"ND0006","type":"t","text":"Approximate value- New constructions 2004-1 - 2012-4"}]
PxWeb API POST request • Example of POST request into the url "http://instat.gov.al:8080/api/en/DST/OS/DVS/DVS0008/" • {"query": [{"code": "NivArsim", "selection": {"filter": "all","values": ["*"]}},{"code": "urban_rural", "selection": {"filter": "all","values": ["*"]}},{"code": "Vit", "selection": {"filter": "all", "values": ["*"] }}],"response": { "format": "json" }}: • response • {"columns":[{"code":"NivArsim","text":"Level of Education ","type":"d"},{"code":"urban_rural","text":"urban_rural","type":"d"},{"code":"Vit","text":"Year","type":"t"},{"code":"Instat1","text":"Women Percentage","type":"c"}],"comments":[],"data":[{"key":["1","1","2013"],"values":["3.0"]},{"key":["1","2","2013"],"values":["5.9"]},{"key":["2","1","2013"],"values":["26.9"]},{"key":["2","2","2013"],"values":["55.0"]},{"key":["3","1","2013"],"values":["46.9"]},{"key":["3","2","2013"],"values":["33.9"]},{"key":["4","1","2013"],"values":["23.2"]},{"key":["4","2","2013"],"values":["5.2"]}]}
PX-Web API use in INSTAT • Programmatic access to our pxweb database • Internal use for our Data Visualization Project • Charts and table data are provided from px web database using pxweb api queries • Users can programmatically access our database for automatic update of figures in their reports
PX-Web API use in INSTAT Visualization of INSTAT publications
About Data Visualization Project Visual Studio 2013 SQL Server 2012 ASP.net .Net Framework 4.5 Entity Framework (Database First Model) LINQ JQuery JQPlot Pivot js
About Data Visualization Project Visualization of INSTAT publications (Tables) Pivot.js
About Data Visualization Project Visualization of INSTAT publications (Charts) Jqplot
Future plans • Visualize main INSTAT publication • Create a loading application to populate the database • Extend the use of the API for other purposes • External users as well