Download
1 / 40
400 likes | 532 Views
Accessing Real Time Data to Drive Continuous Improvement. Dawes Middle School NDE Data Conference April 3, 2012. We Care, We Learn, We Hope…. Building Positive Relationships Intentional Teaching and Learning Fostering Hope in our Community So ALL students can be successful.

E N D
Accessing Real Time Data to Drive Continuous Improvement Dawes Middle School NDE Data Conference April 3, 2012
We Care, We Learn, We Hope….. Building Positive Relationships Intentional Teaching and Learning Fostering Hope in our Community So ALL students can be successful.
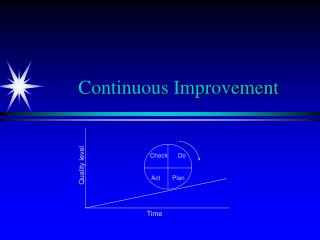
The Road to Continuous Improvement Collaboration Student Learning Data
Dawes Middle School Continuous Improvement Teaching/Appraisal
Data Sources and Access Data Dilemmas • Summative Sources • ITBS, District Summatives, NeSA • Useful for placement and initial problem solving • AS400 Reports were difficult to manipulate • Access to data was limited to a few • Access to data was not timely
Data System Needs & Wants • “Real Time” Data- Meaningful formative data collected and published in a timely manner • “Equal Access”- Accessibility to data at all levels- leadership, teachers, support staff at any time, even the same time. • “Efficient & Effective”- Easy to enter, access, manipulate, and use. We don’t want this to take too much time or not be worth the investment. • “Aligned with Work”- Data that is part of our work not isolated and used to inform and drive work.
What do we collect? • “Real Time” formative data • Academics- grades, teachers use formative assessment data specific to their classrooms or PLCs • Behavior- BIST movements, referrals, escorts/coaches • Attendance- Tardy 2-7, Tardy to school • Socio Emotional- SCIP, Bullying, Social Worker, Counseling referrals and ongoing work
How do we collect/manage? • Google Doc Spread Sheets • Teams upload information using google forms • Teachers upload information using links or logging in • Support staff upload information using link • Organize by Tabs • Grades • Months • Organize by Zones • Reeves Data Team Model (Red, Yellow, & Green Zones) • Holly Lueth
How do we use it • Design Teams Continuous Improvement • Behavior Problem Solving • Academic Problem Solving • Individual Classrooms • Continuous improvement • Manage and analyze data • Differentiation of instruction • School Wide Continuous Improvement • System Monitoring • Identify concerns or gaps • PLCs • Continuous Improvement process • Manage and analyze data • Differentiation of instruction
School Wide Data Systems Tardies to Period 2-7 • Purpose in creating this system: • Have a process to track tardies by month and a system put in place that will decrease the number of tardies. • Data • Started in January 2000 - Averaging 200 tardies/day • Feb 2012 – Averaged 8.5 tardies/day
Tardies to School • Looking at the brutal facts!
Tardies to School • More brutal facts • 1 student missed 515 minutes of instruction in one month • On Jan 20th there were 40 tardies and 697 instructional minutes were lost because of tardies
Tardies to School We made adjustments and changed the tardy to school policy. After 8 days: Average tardies to school 13/day On March 19th – 295 instructional minutes lost Nine of the students have 5 or more
Behavior Problem Solving Purpose in creating this system: • Have a process for intervening behaviorally for students Outcomes: • -Teachers will be able to develop protective plans for students who are missing skills and make a positive difference in student learning.
Behavior Problem Solving • Step 1 – Teachers enter student movement into the google doc form.
Behavior Problem Solving • Step 2 – After the information is dumped in the spreadsheet, we look for students who have 3 or more movements in a month.
Behavior Problem Solving • Step 3 – Student is placed on team’s agenda to develop a protective plan. Prior to the meeting teachers fill out google docs form to gather information.
Behavior Problem Solving • Step 4 – Team meets to develop a plan. Plan is uploaded into docushare. Log of students who have gone through the problem solving process is kept in a spreadsheet in google docs.
Academic Problem Solving 2 Purposes in Creating this System: • Have a process for intervening academically for students • Help teachers identify the priority students (lots of D’s and F’s) 2 Outcomes: • -Teachers will be able to plan and differentiate instruction to engage individual and groups of students so they master learning objectives. • -Teachers will collaborate to identify strategies and practices that engage all students and make a positive difference in student learning.
Academic Problem Solving • Google docs created for teachers to enter grades—”Zoning Data” • Teachers enter/update grades at beginning of a department meeting for about 10 minutes once per month • Teachers use the data to look for priority students • Problem solving began for priority students with considerations of all students
Academic Problem Solving Zoning Data Coding System • Red Zone=Decrease in grades • Yellow Zone=Stayed same or entered list for first time • Green Zone=Improvement in grades
Academic Problem Solving • Semester 1 grade 6: 29 in red zone • February review point: 24 in red zone • Semester 1 grade 7: 35 in red zone • February review point: 29 in red zone • Semester 1 grade 8: 43 in red zone • February review point: 29 in red zone
Academic Problem Solving Next Year • Transition data for next year’s students collected including summative data points like: ITBS, NESA, COGATS • This will be available to all staff to start the year next year as a school wide screening tool.
Literacy Team • Use docushare to store spreadsheets for multiple data points • Each teacher responsible for entering own data • Psychologists uses data to propose groupings for re-teaching • Team Meetings (1x per week) and PLC’s groupings are reviewed, progress reviewed and instructional plan altered as needed.
Literacy Team Docushare Benefits • Excel sheets with “functions” already created • Anyone on staff can access the forms Google Doc Benefits • Anyone can access the data in real time *May look into switching over for next year.
Professional Learning Communities • As a PLC, we collect: • Formative classroom data • Summative Assessment data • We collect it in order to: • Know what skills students have mastered • Know what skills students are struggling with
Professional Learning Communities • 8th English PLC NeSA-W Zoning 2012 • 8th English PLC: Character Analysis Essay Data • 8th English PLC Reading Comp. Data 2010-11
Professional Learning Communities • Using GoogleDocs as a PLC provides: • Early intervention with missing skills • Guidance for our daily instruction • An effective and efficient way to monitor student work • Opportunities for an immediate response • Regrouping
Classroom Teacher Perspective Zoning Data
Formative Assessments • 6th Grade Math Class • Visual Learning Progression • I collect formative data • I give real-time feedback • This process increases: • Student engagement • Student involvement • Student motivation • Positive Community • Student achievement