
Liquefaction Hazards – From Mapping to Implementation
Liquefaction Hazards – From Mapping to Implementation. ULAG 2015 Salt Lake City, Utah. Steven F. Bartlett, Ph.D., P.E. Associate Professor University of Utah. Utah Liquefaction Advisory Group. Members Steve Bartlett, UU CE, Facilitator Mike Hylland, UGS liaison

Liquefaction Hazards – From Mapping to Implementation
E N D
Presentation Transcript
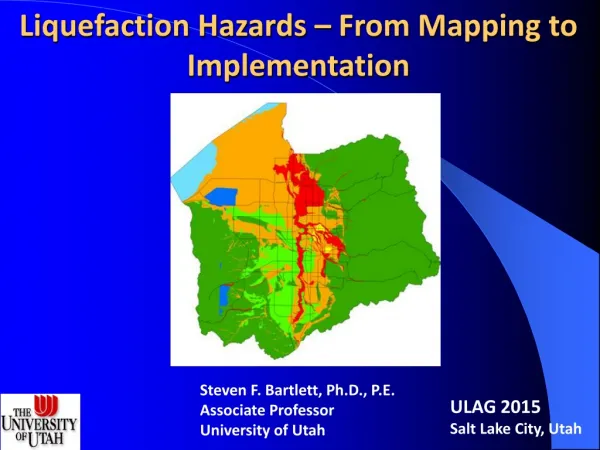
Liquefaction Hazards – From Mapping to Implementation ULAG 2015 Salt Lake City, Utah Steven F. Bartlett, Ph.D., P.E. Associate Professor University of Utah
Utah Liquefaction Advisory Group Members Steve Bartlett, UU CE, Facilitator Mike Hylland, UGS liaison Mark Petersen, USGS liaison Les Youd, BYU CE Travis Gerber, BYU CE Kyle Rollins, BYU CE Loren Anderson, USU CEE Jim Bay, USU CEE John Rice, USU CEE Aurelian Trandafir, UU G&G Michael Olsen, UCSD David Simon, SBI Grant Gummow, UDOT Jim Higbee, UDOT Bill Turner, Earthtec Ryan Cole, Gerhart-Cole
Topics Liquefaction Damage Types of Liquefaction Maps Estimation of Frequency Estimation of Liquefaction Potential Estimation of Ground Displacement Estimation of Settlement Performance-Based Hazard Ordinances
Liquefaction What is liquefaction?
Types of Liquefaction Damage Sand Blow or Sand Volcano
Types of Liquefaction Damage Ground Oscillation Marina District, San Francisco, 1989 Loma Prieta Earthquake
Types of Liquefaction Damage 2011 Tohoku Earthquake Ground Settlement 2010 Christchurch Earthquake
Types of Liquefaction Damage Bearing Capacity Failure 1964 Niigata, Japan Earthquake
Types of Liquefaction Damage Lateral Spread 1964 Niigata, Japan Earthquake
Types of Liquefaction Damage Flow Failure Lower San Fernando Dam 1971 San Fernando Earthquake Valdez, 1964 Alaska Earthquake
Topics Liquefaction Damage Types of Liquefaction Maps Estimation of Frequency Estimation of Liquefaction Potential Estimation of Ground Displacement Estimation of Settlement Performance-Based Hazard Ordinances
Types of Liquefaction Maps • Liquefaction Susceptibility Maps • Liquefaction Potential Maps • Scenario Maps • Probabilistic-Based Maps • Ground Failure Maps • Lateral Spread • Ground Settlement
Types of Liquefaction Maps • Liquefaction Susceptibility Maps • Show liquefaction hazard based on susceptibility (soil capacity), but do not consider demand (size of amplitude of strong ground motion)
Types of Liquefaction Maps • Liquefaction Potential Maps • Combine liquefaction susceptibility (capacity) with seismic input (demand). • Demand can be expressed as a deterministic scenario event or a probabilistic-based estimate obtained from the national seismic hazard maps Liquefaction potential for approximate 0.2g pga (Anderson and Keaton)
Types of Liquefaction Maps • Ground Failure Maps • Consider liquefaction potential • Consider consequences of liquefaction (i.e., displacement) • Median probabilities of lateral spread displacement for 2,500-year return period seismic event
Types of Liquefaction Maps(ULAG Maps funded by NEHRP) • Liquefaction Potential and Ground Displacement Maps • Seismic Strong Motion (SM) Inputs for Liquefaction Potential Maps • M7.0 Earthquake • SM with 10% probability of exceedance in 50 years • SM with 2% probability of exceedance in 50 years • Lateral Spread maps (using above scenarios) • Ground settlement maps (using above scenarios) • Fully aggregated liquefaction map with PSHA input • (see next two slides)
Topics Liquefaction Damage Types of Liquefaction Maps Estimation of Frequency Estimation of Liquefaction Potential Estimation of Ground Displacement Estimation of Settlement Performance-Based Hazard Ordinances
Estimation of Frequency How often do bad things happen? Average return period of event (yrs.)?
Relative Frequency Frequent Moderately Frequent Infrequent Rare Frequency of Event1 0 to 500 yrs. 500 to 1000 yrs. 1000 to 2500 yrs. > 2500 yrs. Estimation of Frequency 1 Frequency of event means that the average return period occurs within that time range. For example if a frequency range is between 0 to 500 years, this implies that the event has an average repeat time that falls between 0 and 500 years. The frequency of the event must be established by geological/geotechnical evaluations.
Topics Liquefaction Damage Types of Liquefaction Maps Estimation of Frequency Estimation of Liquefaction Potential Estimation of Ground Displacement Estimation of Settlement Performance-Based Hazard Ordinances
Estimation of FrequencyLiquefaction Potential P(L) = SP [ L | A,M] P [A, M] where: P(L) = annual probability of liquefaction P [ L | A,M] = conditional probability of liquefaction given the peak ground acceleration and the earthquake magnitude, P [A, M] = joint probability density function of peak ground acceleration and earthquake magnitude.
Estimation of FrequencyLiquefaction Potential Recommended “Probabilistic” SPT-Based Liquefaction Triggering Correlation (For MW=7.5 and sv’=1.0 atm) (Seed et al. 2003)
Estimation of FrequencyLiquefaction Potential • Subsurface data collection • Standard Penetration Testing (SPT) • Cone Penetrometer Testing (CPT)
Estimation of FrequencyLiquefaction Potential • Subsurface data collection • Standard Penetration Testing (SPT)
Estimation of FrequencyLiquefaction Potential • Subsurface data collection • Cone Penetro-meter Testing (CPT)
Estimation of FrequencyLiquefaction Potential • Subsurface data collection • Cone Penetrometer Testing (CPT)
Estimation of FrequencyLiquefaction Potential Geology Map Borehole Map
Median probabilities of PL, 2,500-year seismic event Liquefaction Potential Maps(Weber County) Median probabilities of PL, 500-year seismic event
Topics Liquefaction Damage Types of Liquefaction Maps Estimation of Frequency Estimation of Liquefaction Potential Estimation of Ground Displacement Estimation of Settlement Performance-Based Hazard Ordinances
Estimation of Ground Displacement • P(DH > x) = S P[ (DH > x) | L] P[ L | A, M, R ] P[A, M, R]Where: • P(DH>x) = The probability of lateral spread exceeding a threshold value (e.g., x= 0.1 m and 0.3 m) • P[L| A,M,R] = the probability of liquefaction given an acceleration, magnitude, and source distance. • P[A,M,R] = joint probability density function of peak ground acceleration, magnitude and source distance.
Estimation of Ground Displacement(Salt Lake Valley) Youd, Hansen, Bartlett (2002) Empirical Model Free-face ratio: W (%) = H / L * 100 • Seismic Factors • M, R • Topographic Factors • W, S • Geotechnical Factors • T15 , F15 , D5015
Ground Displacement (Salt Lake Valley) Lateral Spread or 500 and 2500-year scenarios
Ground Displacement (Salt Lake Valley) Lateral Spread or 500 and 2500-year scenarios M 7.0 Lateral spread displacement map (85 percent chance of non-exceedance)
Estimation of Ground Displacement(Weber Co.) Gillins and Bartlett (2013) Empirical Model xi = the portion (decimal fraction) of T15 in a borehole that has a soil index corresponding to the table below
Ground Displacement (Weber Co.) Lateral Spread or 500-year scenario • Median probabilities of exceeding 0.3 m, 500-year event • 84th percentile probabilities, of exceeding 0.3 m, 500-year event
84th percentile probabilities, of exceeding 0.3 m, 2500-year event Ground Displacement (Weber Co.)Lateral Spread or 2500-year scenario Median probabilities of exceeding 0.3 m, 2500-year event
Topics Liquefaction Damage Types of Liquefaction Maps Estimation of Frequency Estimation of Liquefaction Potential Estimation of Ground Displacement Estimation of Settlement Performance-Based Hazard Ordinances
Estimation of Settlement (Tokimatsu And Seed, 1987)
Estimation of Settlement (Ishihara and Yoshimine 1992).
Settlement (Salt Lake Valley) for 500 and 2500-year scenarios 500-yr event 2500-yr event
Topics Liquefaction Damage Types of Liquefaction Maps Estimation of Frequency Estimation of Liquefaction Potential Estimation of Ground Displacement Estimation of Settlement Performance-Based Hazard Ordinances
Performance-Based Hazard Ordinances • What constitutes “acceptable risk?” • Need a graded, risk-based approach based on performance goals. • Level of seismic hazard quantified by frequency or return period of event. • Facilities/structures/systems classified according to importance. • Performance goals defined for each class • Input owners/stakeholders/public • Performance goal(s) evaluated in design process.
Functional Classification Examples Critical (Seismic Use Group III ) Hospitals, fire and police stations, emergency response command and control centers, vital utilities and services. Essential (Seismic Use Group II) Essential government and commercial facilities. Multi-unit housing. Important cultural and religious facilities. Facilities containing hazardous or toxic substances. Important bridges and major transportation corridors. Important (Seismic Use Group I) Single unit residential housing. Non-essential commercial facilities and utilities. Secondary streets and transportation arteries. Routine Non-habitable structures (e.g., garages, sheds, storage facilities, etc.) and private roads. Classification of Systems
Performance Goal Level 1 No loss of life or injury to occupants.No release ofhazardous or toxic substances. Level 2 No significant loss of life or major injury to occupants orsignificant release of hazardous ortoxic substances. Level 3 Safety goals are not applicable because these facilities or structures are not used for occupancy. Safety/Environmental Performance Goals
Goal Level 1 (Operational) Facility or structure is functional and operational immediately following the event without interruption or repair. Level 2 (Immediate Occupancy) Facility, structure or system is functional and safe for occupancy soon after the geohazard event without significant loss of function or interruption. Structures should be safe for occupancy and use within days to a few weeks of the event with only minor interruption or repair. Level 3 (Damaged/Repairable) Facility, structure or system is damaged but repairable following the geohazard event with some interruption. Structures should be safe for occupancy or use within several months after the event with major interruption and repair. Level 4 (Damaged/Irreparable) Facility, structure or system is severely damaged and is not repairable. Structures are not safe for occupancy and not repairable; but have not collapsed. Systems Performance Goals
Functional Classification Frequency of Geohazard Safety Performance Goal System Performance Goal Critical Frequent Moderately Frequent Infrequent Rare Level 1 Level 1 Level 1 Level 1 Level 1 Level 1 Level 1 Level 1 Essential Frequent Moderately Frequent Infrequent Rare Level 1 Level 1 Level 2 Level 2 Level 1 Level 1 Level 2 Level 3 Important Frequent Moderately Frequent Infrequent Rare Level 1 Level 1 Level 2 Level 2 Level 1 Level 1 Level 3 Level 4 Routine Frequent Moderately Frequent Infrequent Rare NA NA NA NA NA NA NA NA Performance Goals vs. Event Frequency


