Download
1 / 32
320 likes | 465 Views
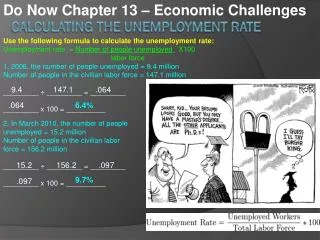
How BLS calculates the Unemployment Rate. USING BLS DATA POSTED JANUARY 7, 2011. United States population: 312 million.

E N D
How BLS calculates the Unemployment Rate USING BLS DATA POSTED JANUARY 7, 2011
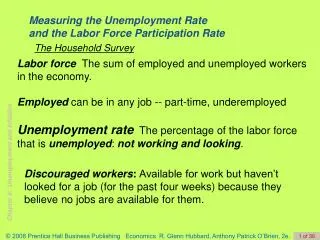
United States population: 312 million. To quantify the extent of the problem of unemployment, we start with the civilian, non-institutionalized, off-the-farm population (16 and older) of 238.9 million. Then, surveying by phone, we ask a series of questions to arrive at the unemployment rate.
1. Are you currently employed? • Yes. • B. Yes, but only part time. • A + B = Employed = 139.2 million.
1. Are you currently employed? • Yes. • B. Yes, but only part time. C. No. No = 238.9 – 139.2 = 99.7 million. Are all these people actually unemployed? No = 238.9 – 139.2
2. If “No,” are you actively looking? • Yes. Yes = Unemployed = 14.5 million.
2. If “No,” are you actively looking? • Yes. B. No. No = not working; not looking No = 99.7 – 14.5 = 85.2 million. These people are not in the labor force.
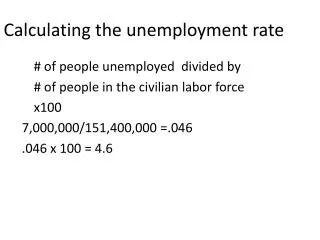
The Unemployment Rate = Unemployed Labor Force Unemployed Employed + Unemployed Unemployed Labor Force Looking Working + Looking
The Unemployment Rate = Unemployed Labor Force Unemployed Employed + Unemployed Unemployment Rate = 14.5/ (139.2 + 14.5) Unemployment Rate = 14.5 / 153.7 Unemployment Rate = 0.094 = 9.4 percent
To those not employed and not looking: 3. Why aren’t you looking for a job? A. I don’t want a job. B. I’m discouraged—I can’t find one. “Discouraged Workers” = 1.3 million.
The Unemployment Rate (Discouraged Worker included) Unemployed plus Discouraged Worker Labor Force plus Discouraged Worker = (14.5 + 1.3) / (153.7 + 1.3) The U+DW Rate = 0.102 = 10.2 percent
Click here for an update. 9.4% This is the unemployment rate for December of 2010, as reported by the BLS on Friday, January 7, 2011. For later reports, see the UPDATE at the end of this show and/or check the BLS website.
The Labor Force Participation Rate Labor Force Population (16 and older) LFPR = 153.7 million / 238.9 million LFPR = 0.643 = 64.3 percent
CATEGORIES OF UNEMPLOYMENT: frictional (still looking) Not in the Labor Force
CATEGORIES OF UNEMPLOYMENT: frictional (still looking) plus structural (a mismatch) If this typewriter repairman loses his job, he’ll be structurally unemployed!
W W W Supply Supply Supply Demand Demand Demand N N N Market for Labor Skilled Labor Unskilled Labor Macroeconomists refer to this 5%–6% band as the natural rate of unemployment. That is, it is perfectly natural in a market economy for the workforce to experience unemployment in this range. In a healthy economy, frictionally unemployed workers and structurally unemployed workers make up five-to-six percent of the workforce. Note that the natural rate of unemployment, like the normal levels of inventory in other markets, is consistent with labor-market equilibrium. W W Supply Supply Demand Demand N N Industrial Labor Agricultural Labor W W Supply Supply Demand Demand Structural Unemployment N N Western-States Labor Plains-States Labor
Employment and Unemployment In a Healthy Market Economy NOTE: The economy’s workforce (or labor force) includes employed workers and unemployed workers and constitutes about half of the US population. NOTE: The unemployment rate is the ratio of the unemployed workers to the labor force. In the U.S., the ratio is 5%–6% when the economy is in good macroeconomic health. NOTE: The ratio of the labor force to the adult population (16 years old and older and not institutionalized) is called the labor-force participation rate. In the U.S., this ratio is about 65%. NOTE: W W Supply Demand N N Adult population (16 years old and older) minus military personnel minus the institutionalized citizenry Market for Labor Employed workers Frictionally and structurally unemployed workers Not in the labor force
Cyclical Unemployment In a Depressed Market Economy Cyclical unemployment occurs when there is an overall reduction in the demand for labor (a reduction not warranted by some change in preferences or in overall resource availabilities). NOTE: The unemployment rate reported by the BLS includes frictional, structural, and cyclical unemployment. NOTE: NOTE: Frictional and structural unemployment make no explicit showing in the analytical reckoning. NOTE: The amount of cyclical unemployment (currently 3.4% or 3.9%) makes an exaggerated appearance in the analytical reckoning. W Supply Demand N Adult population (16 years old and older) Adult population (16 years old and older) minus military personnel minus the institutionalized Cyclically unemployed workers Employed workers Employed workers Frictionally and structurally unemployed workers Not in the labor force
CATEGORIES OF UNEMPLOYMENT: frictional (still looking) plus structural (a mismatch) = THE NATURAL RATE = 5%-6%
THE RESIDUAL CATEGORY: Measured Rate of Unemployment minus the Natural Rate = CYCLICAL UNEMPLOYMENT
The level of unemployment consistent with sustainable prosperity--i.e., the natural rate of unemployment--has long been believed to be in the range of A. 2 to 3 percent. B. 3 to 4 percent. C. 4 to 5 percent. D. 5 to 6 percent.
Ferris Beuller graduated from college during the Bush recession. He spent 1990 looking in vain for reasonable employment. Totally discouraged, he spent 1991 playing Minesweeper on his girlfriend’s computer. The Bureau of Labor Statistics would classify Mr. Beuller (in 1991) as A. self-employed. B. institutionally unemployed. C. a discouraged worker. D. structurally unemployed.
NBER’s Call: End of Recession Beginning of Recovery (June 2009) REPRESSED OR DEPRESSED ECONOMY 6% 5.5% 5% OVERHEATED ECONOMY NBER’s Call: End of Expansion
10% 9% 8% 7% 6% T H E N A T U R A L R A T E O F U N E M P L O Y M E N T 5% 1992 2011 4%
10% 9% 8% 7% SEPT 11 2001 6% 5% 4%
10% 9% 8% 7% SEPT 11 2001 6% 5% 4%
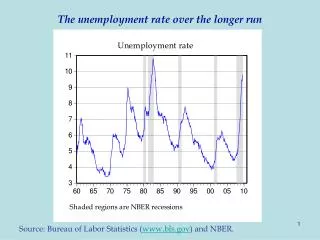
What is the source of the dramatic gyrations around full employment? Are they inherent in the nature of market economies? Or are they perverse consequences of ill-conceived or politically motivated macroeconomic policy?
10% UPDATE 9% 8% 7% 6% T H E N A T U R A L R A T E O F U N E M P L O Y M E N T 5% 1992 2011 4%
10% 9% 8% 7% SEPT 11 2001 6% 5% 4%
THE EMPLOYMENT SITUATION JANUARY 2011 The unemployment rate fell by 0.4 percentage point to 9.0 percent in January, while nonfarm payroll employment changed little (+36,000), the U.S. Bureau of Labor Statistics reported today. Employment rose in manufacturing and in retail trade but was down in construction and in transportation and warehousing. Employment in most other major industries changed little over the month. THE EMPLOYMENT SITUATION JANUARY 2011 The unemployment rate (9.0 percent) declined by 0.4 percentage point for the second month in a row. The number of unemployed persons decreased by about 600,000 in January to 13.9 million, while the labor force was unchanged. (Based on data adjusted for updated population controls.) SEPT 11 2001