Download
1 / 31
310 likes | 398 Views
Multi-Commodity Flow Joe Monahan Josh Onuska. Back Story. N.S. - Largest rail shipper of automobiles Scope Exclusive deal with Ford (1.9 million sold in 2010) Facilities operating 24 hours / 7 days East Coast distribution Risks Terrorism or war Labor union strikes Severe weather

E N D
Multi-Commodity Flow Joe Monahan Josh Onuska
Back Story • N.S. - Largest rail shipper of automobiles • Scope • Exclusive deal with Ford (1.9 million sold in 2010) • Facilities operating 24 hours / 7 days • East Coast distribution • Risks • Terrorism or war • Labor union strikes • Severe weather • Derailing / rail failure
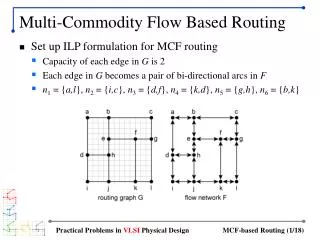
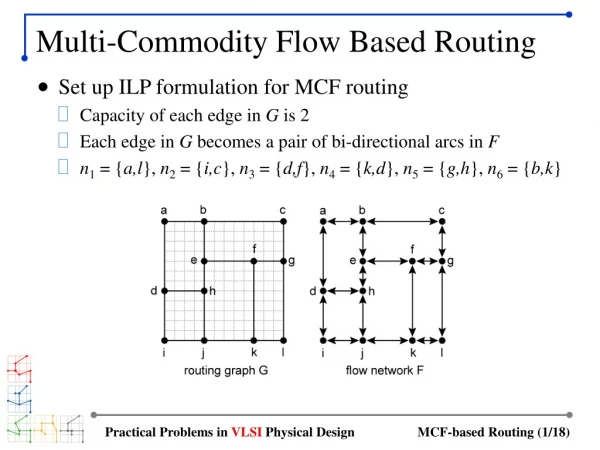
Nodes and Arcs • Nodes • 5 assembly plants • 4 mixing centers • 25 distribution facilities • Arcs • 22,000 miles of rail • 30,000 Ford vehicles shipped weekly • Capacity is more than sufficient to handle demand
Assembly Plants LocationSupplyModel Cleveland 5,000Econoline Van Chicago 5,000 Taurus, Explorer Detroit 10,000 Mustang, F-150, Focus Kansas City 5,000 F-150, Escape,Contour Louisville 5,000 SuperDuty,Expedition,Navigator
Mixing Centers LocationCapacityRegion Chicago 5938 NE/NW Louisville 3510 SE/E Toledo 2800 NE Kansas City 2538 NW/MW
Model • Multi-commodity: Sorted (5) / Mixed • Supply/Demand Driven • Supply = 30,000 • Demand = 30,000 • 60,000 units in motion • Accounts for 75% of Ford’s monthly U.S. sales • Network Risks • Arcs unusable • Weather • Accident • Unions • Bridges
Assembly Sinks Assembly Plants 5000 A -5000 Cleveland(Avon Lake) Mixing Stations 5000 C -5000 Chicago 10000 Detroit (Dearborn/Wayne) -10000 Toledo D Kansas City -5000 -5000 Louisville K Chicago 5000 L 5000 Louisville Kansas City -30,000 30,000 Mixed Source Mixed Sink
Network Characteristics • Network Goal • Meeting demand at the minimum cost • DNM: Current vs Future Profit loss • Measure of effectiveness • Average cost to deliver vehicle to distribution facility • MOE = Total Cost / # of cars shipped • Total Cost = (.25)(Rail Miles) + (DNM)($2700)
Assumptions • 30,000 cars moved per week (From Mid-West Plants) • 20,000 to East Coast / 10,000 to West Coast • $0.25 per rail mile for each car moved • No cost incurred for movement between co-located facilities • DNM results in lost sales
Assembly Plants to Mixing Facilities Mixing Facility Assembly Plant
Initial Results • Base line – zero attacks: • Total Mileage: 25,511,500 Rail miles • Total Cost: $6,377,875.00 • Cost per vehicle: $212.00
Results w/ Interdiction • 1 Interdiction • 23,219,000 Miles; $11,204,750; $386.37/car • 5 Interdictions • 14,460,000 Miles; $49,515,000; $2,303.02/car • 10 Interdictions • 8,010,000 Miles; $88,402,500; $6,314.46/car • 17 Interdictions • 5,010,000 Miles; $139,600,500; $31,872.60/car
Resiliency Curve Attack Saturation Cost over profit margin
Charts: Cost of Interdiction • Map of varying paths after each interdiction • And/or histograms of cost at each interdiction
Resiliency • How do we make the system more robust and resistant to catastrophic collapse? • Add arcs to isolated nodes • Back up plan (trucks) • Can we move nodes around (mixing stations or distribution points) to get a more efficient solution? • Moving or even eliminating mixing stations improves performance.
Additional Analysis • Option to eliminate one of the four mixing facilities: • Bypassed Chicago • $194,375 in weekly savings
Analysis Limitations • Lots of assumptions • Changes in Consumer Demand by geographic location
Conclusion • What did we learn from the model? • Hub and spoke affect • How does the model react to interdiction? • Greatest impact from interdiction seen in DNM • Critical vulnerabilities? • Isolated nodes, close proximity of Assm. Plants • How can we improve the system to lower cost? • Eliminate Mixing Facility • Diminishing returns after 17 attacks