Download
1 / 20
200 likes | 304 Views
Brown-to-Green. Converting the UPS Fleet to Electric Drive. Presented To : UPS Fleet Operations Presented by : Forward Motion Byrant Dulin, Dean Martucci, Max Dunn, Nayelli Gonzalez, Patrick Stafford Date : April 19, 2009. UPS Van Fleet. 80,000 Package Vans 98 miles per day

E N D
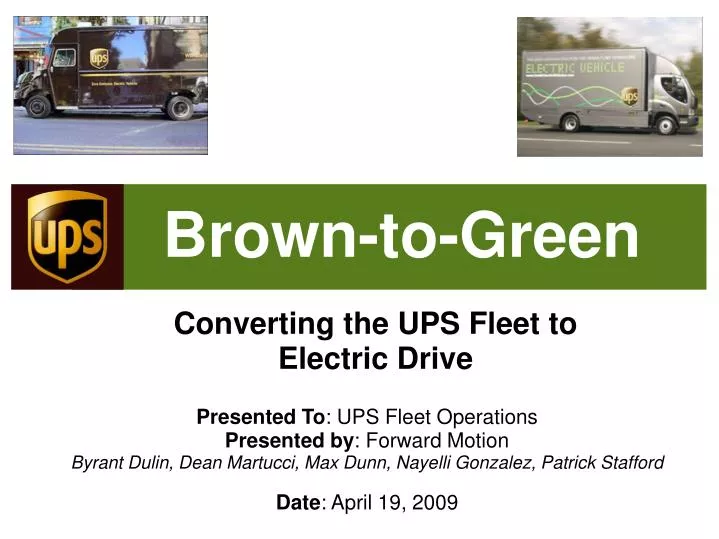
Brown-to-Green Converting the UPS Fleet to Electric Drive Presented To: UPS Fleet Operations Presented by: Forward Motion Byrant Dulin, Dean Martucci, Max Dunn, Nayelli Gonzalez, Patrick Stafford Date: April 19, 2009
UPS Van Fleet • 80,000 Package Vans • 98 miles per day • 32 MPH average • 7.1 MPG • Life: 13 years • Replacement cost: $56,000
Electric Conversion • Use vans at end-of-life • Take out and recycle engine and transmission • Install motor, controller, batteries, generator • Battery range: 25 miles • Extended range: 600 miles • 25 MPG average
Conversion Proposal • Convert 100 vehicles • Build recharging station for 100 vehicles
Conversion Costs • Conversion cost: $53,000 • Batteries (42 kWh): $22,000 • Motor package (215 kW): $7,500 • Generator (55 kW): $7,000 • Misc: $5,000 • Installation: $11,500 • Total $5.3M for 100 vehicles (Source: ElectraDrive)
Operating Savings [DATA SOURCES - SEE NOTES SLIDE] • 70% ENERGY SAVINGS • $3200/vehicle annual savings • 45% TOTAL SAVINGS • $4700/vehicle annual savings • LOWER TAXES & ROAD USE FEES • LESS MOVING PARTS • Higher MTBF, Lower MTTR • REDUCED OIL & FILTER WASTE • Begin recycling batteries Cost per Mile comparison CLASS FUEL MAINTENANCE TOTAL UPS Diesel .186 (@ $2.09/gal) .23 .416 FORWARD MOTION EV .055 (@ .11550/kWh) .17 .227
Operating Comparison • Compare Apples to GREEN Apples RANGE LOAD SPEED AC CONTROL IMPROVED ACCELERATION SAFER DRIVING FASTER ROUTES UPS Diesel 98 mi. typ. 1600 lb. 35 mph avg. Idle during foot delivery FORWARD MOTION EVs 25 batt only. 600miles w/gen. 1525 lb + 50 mph Optional AC w/ PV roof array Quicker than diesel Tighter turning radius. Lighter. Use Hi-Density Lanes Total Annual Operating Savings for proposed 100 vehicle EV fleet: $470,000 .
Charging Stations • Cost/Station • $3,000 • Installation Cost/Station (est) • $1,125 • Total Cost (100 Truck Station) • $412,500
State Strategy AB 32 AB 118 AB 1007 State & Alternatives Fuel PlanAlternative and Renewable Fuel and Vehicle Technology Program
Grants and Incentives Air Quality Improvement Program (AQIP) Diesel Emissions Reduction Act (DERA)
UPS - Carbon Disclosure Project Trends suggest that GHG regulation on the transportation industry is forthcoming. As regulations emerge, UPS will establish industry leadership and will accelerate its investment in innovation. [One way] these opportunities will manifest themselves is in carbon/energy efficient transport. - UPS 2008 GHG Emissions Questionnaire,
U.S. Carbon Emissions Regulation Another major incentive is the potential for federal emissions regulation • Obama Administration • Environmental Protection Agency • Waxman-Markey Bill (American Clean Energy Security Act of 2009) • 3% below 2005 levels in 2012
Cap and Trade Systems • Existing mandatory and voluntary market-based efforts in the U.S. to reduce greenhouse gas emissions
Reduce CO2 Liability Over Time • Electric Vehicles will help UPS achieve reduction targets and position UPS to profit from the emerging carbon trading market 2007 Total CO2 Emissions 2007 CO2e Per Vehicle in Van Fleet Savings Per Vehicle with EV Fleet 7,470,000 metric tonnes 22 metric tonnes 32 metric tonnes
Industry Trends • DHL wants “5000 new electric trucks a year” • FedEx adding 75 new Electric trucks 2009 • Have over 170 hybrids already in use • Supply of New EV Trucks can’t meet current Demand
Sustainability • Less Dependence on Oil • Less Fuel-Based Carbon Emission • Less Harmful Materials for Employees to Handle • More Company Culture Awareness of Sustainability • More Value to the Triple Bottom Line!
Proposal Summary Up Front Costs & Incentives • 100 vehicle conversion to EV: $5,300.0K • 100 recharging stations: $ 412.5K • Replacing 100 new diesel buy: $(5,600)K Total Net Difference: $ 112.5K Less Fed & State incentives: (varies by state) Annual Savings • Operating Savings: $ 470.0K • Carbon credits: $ 4.4K Bottom Line Pays off in 1st Qtr
Notes Notes • Notes on OPERATING COSTS • UPS DIESEL • Data compiled from “UPS CNG TRUCK FLEET Final Results, DOE, National Renewable Energy Lab, 1996.”http://pressroom.ups.com/staticfiles/case_studies/19.pdf • Fuel: 1996 UPS data = .107/mile, adjusted for inflation and diesel costs from 1996 to 2009US Historical National Diesel Average Costs: http://tonto.eia.doe.gov/oog/info/wohdp/diesel.aspDiesel avg $1.20/gal in ’96; $2.09 in Mar 09 • Maintenance: 1996 UPS data = .167/mile, adjusted for inflation from 1996 to 2009 • EV THEORETICAL • Fuel: To calculate Energy Cost/Mile, use following table from DOE’s Advanced Vehicle website: http://www1.eere.energy.gov/vehiclesandfuels/avta/light_duty/fsev/fsev_gas_elec2.html • Using EE = 2 miles/kWh (Smith EV “Newton Box Body”; also LA Port Authority EV heavy duty hauler) • And PG&E Mar 2009 baseline electrical usage fee = .11550/kWh • Energy Cost theoretical value = .055/mile • Maintenance: EV maintenance estimated at 75% of ‘96 UPS Maint. data. Adjusted for EV operations as follows: Diesel (actual): Axle, Wheel, Drive Shaft - 2%; Frame, Steering, Suspension -11%; Brakes - 11%; Clutch & Transmission -16%; Inspections - 19%; Tires - 20%; Cab, Body & Accessories - 36%; Total Engine/Fuel Related - 45%; HVAC-2%; Lighting- 5%; Total (w/ overlaps) -167% EV (est): Axle, Wheel, Drive Shaft-2%; Frame, Steering, Suspension-11%; Brakes -10%; Clutch & Transmission -0%; Inspections 19%; Tires-20%; Cab, Body & Accessories -36%;Total Engine/Fuel Related - 20%; HVAC-2%; Lighting-5%; Total (w/ overlaps) - 125%