Download
1 / 16
160 likes | 190 Views
This study discusses alternative analytical methods to accurately measure channel coherence time in support of the TGac channel model. The current measurements may have biases and inaccuracies.

E N D
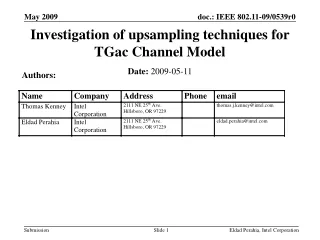
Coherence Time Measurement for TGac Channel Model Authors: Date: 2009-11-17 Greg Breit, Qualcomm Incorporated
Abstract A channel aging metric of 0.5 correlation was used to assess channel coherence time in recent measurement campaigns. For channels with stationary users, this metric is highly insensitive and in many cases may be unachievable in measured data. Consequently, the coherence time measurements to date in support of the TGac channel model appear biased downward, suggesting an unnecessarily high level of channel Doppler. This contribution discusses alternative analytical methods which may produce more accurate and unbiased estimates of channel coherence time from existing measurement data. Greg Breit, Qualcomm Incorporated
Sample Coherence Time Analysis • TGn coherence time defined as delay at which autocorrelation drops to 0.5 • Standard definition from Rappaport, others • Same method used by Intel and NTT for TGac Channel Model • Left hand plot superimposes autocorrelations (pos. lags only) for all TX, RX, and tones • Autocorrelation is not scaled for overlap size, so coherence time>10s not measurable • Right hand plot is CDF of all coherence times (all corr=0.5 crossings) Greg Breit, Qualcomm Incorporated
Asymptotes in Measured Coherence Time Distributions Intel: 1.6s Meas. Duration NTT: 6.4s Meas. Duration Qualcomm: 20s Meas. Duration • All measurements exhibit asymptotic coherence time at high values • Asymptote occurs at ~½ of the measurement duration • Median value falls on asymptote in all cases • Does this impact the reported coherence times? • Qualcomm measurements taken in large auditorium with pedestrian motion Greg Breit, Qualcomm Incorporated
Impact of Data Duration on Observable Coherence Time Data Duration = 20s Data Duration = 10s Data Duration = 1.6s • Coherence time was calculated from segments of complete 20s Qualcomm data record • Data were reanalyzed using 10s and 1.6s segments (latter is similar to Intel meas. duration) • Distributions of coherence time are biased by the data duration • Asymptote is an analysis artifact – both 50% and 10% (left tail) values are impacted • Limiting Qualcomm data to 1.6s duration (right hand plots) produces results very similar to Intel values Channel Autocorrelation Median: 9.3s Median: 4.8s Median: ~800ms Coherence Time CDF 10%ile: 2.0s 10%ile: 5.0s 10%ile: ~500ms Greg Breit, Qualcomm Incorporated
Computation of Correlation • “Biased” form decreases with increasing delay T • Fewer overlapping samples in summation in numerator • Will always approach zero as TL • Can alternatively use “Unbiased” form • Adjusts for number of overlapping samples in numerator summation Greg Breit, Qualcomm Incorporated
Results using “Unbiased” Autocorrelation • Each correlation point is adjusted for the size of the data overlap • Allows observation of coherence time out to total measurement duration • Extreme lags are unreliable due to small number of overlapping samples • No asymptote, but now have cases where 0.5 correlation is never reached • ~90% of cases in this example • 0.5 correlation is not a good metric to evaluate channels with stationary users • Fine for mobile channels, but too insensitive for the non-mobile case Greg Breit, Qualcomm Incorporated
Relevance of Coherence Time Analysis • We care about channel coherence time because it impacts the required rate of CSI update for TxBF and DL MU-MIMO • Direct observation of channel coherence time in static conditions is difficult due to dependence on measurement duration • Calculation is flawed when data duration is limited • 0.5 correlation is a very insensitive metric of channel aging • We need a more sensitive metric of channel aging • Time delay to correlation value ρ (ρ>0.5) • Time delay to XdBc MS channel error (e.g. -20dBc, -30dBc) • Time delay to X% beamformed capacity degradation • TxBF or MU-MIMO • Both NTT (09/0303r1) and Intel (09/0538r4) considered this originally • TGac Doppler model should use a value that reproduces the rate of channel aging observed in measurements Greg Breit, Qualcomm Incorporated
Revisiting the Intel Results (09/0538) • Original Intel analysis focused on TxBF capacity degradation as a function of time delay • Measurements show 49% capacity degradation at 100ms delay • Most extreme Doppler case (“DM”) • 50% capacity loss never reached for more moderate cases (SM, PM, LM) • Intel applied same analysis to 11n Model D (~60ms coherence time) • ~50% capacity degradation at 10ms delay • Suggests a measured coherence time at least 10x of 11n model • 10x60ms = 600ms coherence time in the very worst case (DM) • Longer than 600ms for all other test cases Greg Breit, Qualcomm Incorporated
Revisiting the NTT Results (09/0303r1) • NTT observed approximately 11% capacity degradation after 100ms • Channel measurements performed with pedestrian motion • These results may be compared to existing 11n model or current 11ac model to estimate a coherence time value for the 11ac model • Data suggest a more stable channel than observed by Intel Greg Breit, Qualcomm Incorporated
Alternative Aging Metric – MS Error of Delayed CSI • CDFs of MS error between current and delayed channel (11ac Model D-NLOS) • Expressed in dBc (relative to channel power) • Statistics pooled over time samples and subcarriers • “D/T” in legend refers to ratio of CSI delay to channel coherence time • Sims were performed assuming 400ms coh time, but everything scales… • -30dBc error occurs when channel delay is 1.8% of model coherence time • -25dBc error occurs when channel delay is 2.5% of model coherence time • -20dBc error occurs when channel delay is 5% of model coherence time • This figure provides a basis by which to estimate coherence time from measurements in a D-NLOS-like environment • Requires stable phase in channel estimates over time Greg Breit, Qualcomm Incorporated
Alternative Aging Metric 2 – MS Error of Delayed CSI from Correlation • Straightforward to show that SNR ≡ |ρ|2/(1-|ρ|2), where ρ is the correlation coefficient between S and S+N • MSE of CSI can be estimated from (1-|ρ|2)/|ρ|2 (e.g., ρ=0.995 ↔ -20dBc MSE) • Correlation is more immune to phase drift than direct MSE calculation • Figure shows CDFs of MS error estimated from complex correlation coefficient • Medians are indistinguishable from direct calculation of MSE (previous slide) • Slightly wider distribution • Preferred method for analysis of measured data due to phase drift immunity Greg Breit, Qualcomm Incorporated
Sample Measurements • Channel sounding system (5 GHz) • PHY based on 11n: 20 MHz, 64 subcarriers (48 used for sounding) • 4x4 MIMO channel measured every 40ms • Large lab • Open but highly cluttered environment • Benches, racks, lab equipment, metal cabinets, ventilation shafts • Good representation of Model D • “Typical office, sea of cubes, large conference room” • STA placed NLOS to AP (range 10m) • Four test cases • 1: Baseline – no deliberate motion in channel • 5-10 people working seated in the lab, so some ambient motion • 2-4: Deliberate pedestrian motion down middle of lab • Performed three times for each STA location • Different ped paths each time • Ped path never passes between AP and STA Greg Breit, Qualcomm Incorporated
Measurement Results (analysis of 90%ile) Baseline Ped Motion 1 -30dBc @80ms delay (90%ile) 80ms/1.8% = 4.4s coh time -20dBc @80ms delay (90%ile) 80ms/5% = 1.6s coh time Ped Motion 2 Ped Motion 3 -20dBc @80ms delay (90%ile) 80ms/5% = 1.6s coh time -18dBc @40ms delay (90%ile) 40ms/5% = ~800ms coh time Greg Breit, Qualcomm Incorporated
Summary • Coherence time results to date (Intel, NTT, Qualcomm) appear flawed • Measurements are solid, but analysis is problematic • Insufficient measurement duration to observe ρ=0.5 accurately • Channel with stationary users may never reach ρ=0.5 • Flawed values were the basis for current 11ac Doppler model • Should evaluate data using a more sensitive metric of channel aging • Degradation of TxBF or MU-MIMO capacity vs. delay • Original approach by both Intel and NTT • Growth of CSI MS error vs. delay • Easy to calculate • Expresses channel aging in similar terms as other CSI impairments • Requires stable measurement phase over time • Correlation vs. delay (higher value than 0.5) • Directly analogous to MSE analysis • More tolerant of phase drift than MSE • Channel model Doppler parameter should match measured data in terms of rate of channel aging evaluated by a reliable metric • Current 400ms coherence time assumption appears conservative • TGac channel model should adopt a value >600ms (800ms or 1.6s suggested) Greg Breit, Qualcomm Incorporated
References • Honma, N., et al., “Effect of SDMA in 802.11ac,” Doc. IEEE 802.11-09/303r1 • Perahia, E., “Investigation into the 802.11n Doppler Model,” Doc. IEEE 802.11-09/0538r0 • Perahia, E., “Channel Coherence Time.” Doc. IEEE 802.11-09/0784r0 • Yamada, W. et al., “Coherence Time Measurement in NTT Lab.” Doc. IEEE 802.11-09/0828r0 Greg Breit, Qualcomm Incorporated