Download
1 / 14
140 likes | 278 Views
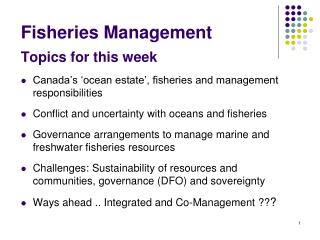
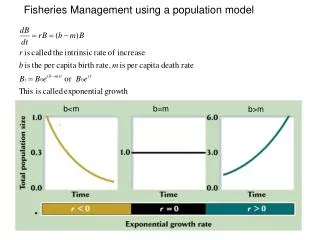
Fisheries Management using a population model. b<m. b=m. b>m. Density dependent birth and death. Per capita birth,death. b=b 0 -b 1 B m=m 0 +m 1 B. b 0. Slope=b 1. m 0. Slope=m 1. K is called the carrying capacity. K. Biomass. B.

E N D
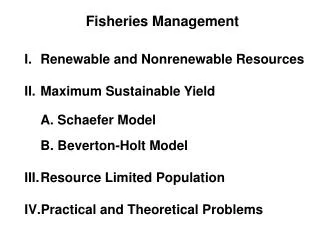
Fisheries Management using a population model b<m b=m b>m
Density dependent birth and death Per capita birth,death b=b0-b1B m=m0+m1B b0 Slope=b1 m0 Slope=m1 K is called the carrying capacity K Biomass B
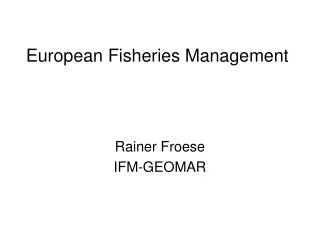
Now we need to incorporate K into the population growth model This is called the logistic equation
per capita rate of increase slows down linearly as the biomass increases and reaches 0 when the carrying capacity (K) is reached. • per capita rate of increase reaches an upper limit of r0 as B approaches 0 • It becomes negative when B>K Is called the logistic equation B K
B K/2 K
B K/2 K
What kind of growth curve does this equation generate?—logistic growth
What would happen to a population at K subjected to a harvest rate of C/t C/t B * K/2 K The population would be reduced which would increase dB/dt The decrease would continue until it reaches *where dB/dt increases enough to offset the harvest rate
How great can this harvest rate be and still be compensated for by increased population growth? C/t B * K/2 K Why is called the maximum sustainable yield?
What would happen to a population at K/2 subjected to a harvest rate of B K/2 K is called the Maximum Sustainable Yield (MSY), why?
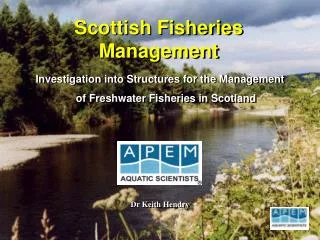
Constant Quota fishing at levels approaching the MSY shortens the biomass range the population will recover, and the likelihood of entering the danger zone increases. Once the danger zone is entered fishing must stop or be severely curtailed Danger zone Stable biomass range Catch rate B K/2 K Maximum Sustainable Yield (MSY)