Download

1 / 34
341 likes | 586 Views
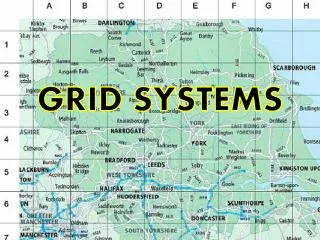
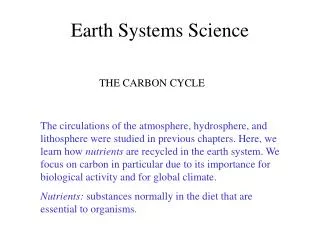
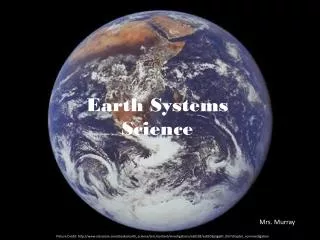
EARTH SCIENCE: LOCATION, GRID SYSTEMS, MAPS, GIS. GRID SYSTEMS: Since geography deals with the position of features on the surface of the Earth, it is important to have some way to accurately specify precise locations. The obvious way of doing this is to use some form of grid system.

E N D
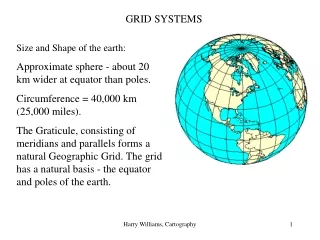
EARTH SCIENCE: LOCATION, GRID SYSTEMS, MAPS, GIS. GRID SYSTEMS: Since geography deals with the position of features on the surface of the Earth, it is important to have some way to accurately specify precise locations. The obvious way of doing this is to use some form of grid system. Harry Williams, Earth Science
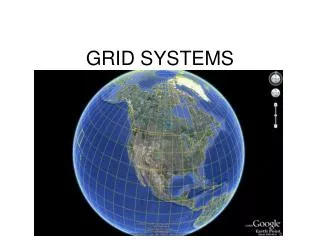
The trouble is that the Earth is a sphere*, not a flat piece of paper - however, there are natural points of reference on the Earth that can be used to construct a grid system (next page). *Note that the earth is not completely spherical - it bulges slightly around the equator - but for our purposes this is negligible. Harry Williams, Earth Science
Topographic Maps, GIS (pages 25-34): Maps are "scaled-down" versions of the real world. The map scale is the ratio of map distance to true distance. There are two main types: 1. Graphic Scale - a line is drawn which is divided into distances. 2. Representative Fraction (RF) - for example, 1:63,360; this means that 1 unit of distance on the map represents 63,360 of the same units of distance in the real world i.e. 1 inch represents 63,360 inches; 1 mm represents 63,360 mm and so on. Harry Williams, Earth Science
In the U.S., the most common map is the United States Geological Survey 7.5 minute quadrangle. These have an RF of 1:24,000 (approximately 2.64 inches to one mile) and cover an area 7.5 minutes of longitude wide and 7.5 minutes of latitude long. Harry Williams, Earth Science
Contour lines, spot heights and bench marks are used to show elevation on the map (topographic = “variation in height over surface”). Harry Williams, Earth Science
Contour line = line of constant elevation above mean sea level e.g. 700 feet (contour interval is stated on map = vertical separation of contour lines). Spot height = accurately surveyed height shown as a small cross on map (not marked on the ground) e.g. x 730 Bench mark = same as spot height, shown by BM x 680 AND marked on ground by a monument. Harry Williams, Earth Science
Contours: imaginary lines of constant elevation. Every 5th contour is bold to facilitate tracing – index contours. Index contours are numbered at a break in the line, with the number “upright” if possible. Harry Williams, Earth Science
The difference in elevation between adjacent contours is the Contour Interval. The contour interval varies depending on the relief of the map – it is usually a multiple of 10 feet. Harry Williams, Earth Science
Bench marks are bronze disks, usually set in concrete in sidewalks, bridges, roadways and other structures. They are accurately surveyed geodetic control points. “Geodetic” refers to the size and shape of the earth. Bench marks are used to provide an elevation reference for engineering projects such as road building. Harry Williams, Earth Science
Topographic Profiles show the shape of the surface between two points on a topographic map. Contour elevations are transferred from the map (usually using a piece of paper as shown) to graph paper. The elevations are plotted on the graph paper with reference to a Y-axis showing elevation. Because distances on the map are transferred directly to the graph paper, the horizontal scale of the profile is the same as the map (i.e. if the map is 1:24,000, the profile horizontal scale is 1:24,000). Harry Williams, Earth Science
However, unlike the map, the profile also has a vertical scale determined by the Y-axis. For example if the Y-axis is 1 inch = 200 feet, this is a vertical scale of 1:2,400. Because of this, profiles usually have vertical exaggeration (vertical scale is larger than horizontal scale). In the example above, the vertical exaggeration is 24,000/2,400 = 10x. How is the vertical scale chosen? It is arbitrary i.e. 1” to 100’ = 1:1,200; 1” = 50’ = 1:600 and so on. So the creator of the profile chooses what the vertical exaggeration will be. Harry Williams, Earth Science
Example: A profile has a horizontal scale of 1:24,000 and a vertical scale of one inch = 100 feet. What is the vertical exaggeration? Harry Williams, Earth Science
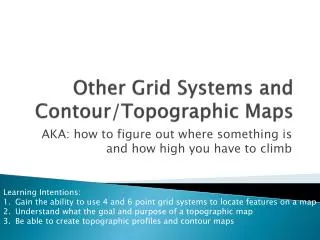
Slopes or gradients: slope expresses the relationship between the change in height of the surface ('rise') with respect to a horizontal shift in position ('run'). On a topographic map, slope is proportional to the spacing of contour lines: closely-spaced contours indicate a steep slope; widely-spaced contours indicate a gentle slope. To quickly determine which way the ground slopes, look for a stream – when contours cross a stream, they form a “V” shape pointing in the upstream direction. Harry Williams, Earth Science
There are a variety of ways in which slope can be expressed. For example, the slope AB, rises 200 feet over a distance of 2 miles. A common way to express slope is in terms of feet per mile; so this is a gradient of 100 feet per mile. A 200 feet B 2 miles Harry Williams, Earth Science
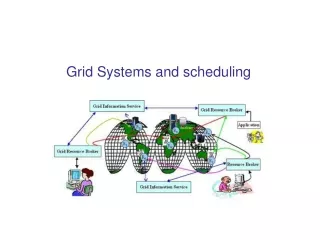
GIS. Geographic Information Systems are essentially computer-based maps and analysis systems. Usually map features are stored in layers in the computer and can be superimposed on screen. Harry Williams, Earth Science
The utilityof GIS is the ability to manipulate and analyze very large amounts of spatial (map) data very quickly. The following GIS has potential sites for a new apartment building in Memphis. Geographic information such business locations, competition and population can be used to select the best site for a new development. Harry Williams, Earth Science
GIS showing 14-minute drive-time polygon for customers of a department store in Atlanta. This gives you an idea of the market area required by your store (size and population). This can help answer questions such as “Is there room for another store in this city?” Harry Williams, Earth Science
A big area of GIS growth is web-based GIS such as Google Maps… Harry Williams, Earth Science