Download
1 / 27
270 likes | 444 Views
Explicit Forecasts of Winter Precipitation Using an Improved Bulk Microphysics Scheme. Part II: Implementation of a New Snow Parameterization.

E N D
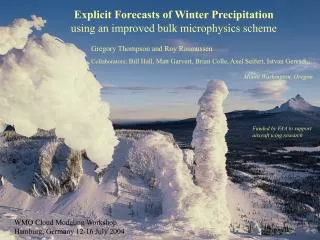
Explicit Forecasts of Winter Precipitation Using an Improved Bulk Microphysics Scheme Part II: Implementation of a New Snow Parameterization Thompson G., P. R. Field, R. M. Rasmussen, and W. D. Hall, 2008: Explicit Forecasts of Winter Precipitation Using an Improved Bulk Microphysics Scheme. Part II: Implementation of a New Snow Parameterization. Mon. Wea. Rev., 136, 5095-5115.
Outline • Introduction • Snow distribution assumptions • Bulk snow density • Particle size distribution (PSD) • Results of sensitivity experiments • Sensitive experiment design • Results • Shallow/warm cloud system • Deep/cold cloud system • Discussion • Snow geometry • PSD diagnostic method • PSD shape
Introduction • In designing this new scheme, the objectives were: • to improve quantitative precipitation forecasts (QPFs), • to improve forecasts of water phase at the surface and aloft (particularly the aircraft icing), • to incorporate recent microphysical observation from various field projects, and • to fulfill the requirements of real-time modeling needs in terms of speed.
Introduction New features specific to this version compared to that described in Part I description include • a generalized gamma distribution shape for each hydrometeor species; • a y-intercept of rain that depend on the rain mixing ratio and whether an apparent source is melted ice; • a y-intercept of graupel that depend on the graupel mixing ratio; • a more accurate saturation adjustment scheme; • a variable gamma distribution shape parameter for cloud water based on observations; • a lookup table for freezing of water drops; • a lookup table for transferring cloud ice into the snow category; • Improved vapor deposition, sublimation, and evaporation; • Variable collection efficiency for rain-, snow-, and graupel- collecting cloud droplets; and • Improved rain-collecting snow and graupel.
Outline • Introduction • Snow distribution assumptions • Bulk snow density • Particle size distribution (PSD) • Results of sensitivity experiments • Sensitive experiment design • Results • Shallow/warm cloud system • Deep/cold cloud system • Discussion • Snow geometry • PSD diagnostic method • PSD shape
Bulk Snow Density Spherical, constant density where =0.1 g cm-3=100kg m-3 (Cf. Lin et al. 1983; Reisner et al. 1998; Hong et al. 2004; Thompson et al. 2004) Nonspherical, variable density as = 0.13D-1 (Cox, 1988)
Snow Size Distribution Reisner et al. (1998) Thompson et al. (2004) Thompson et al. (2008)
Snow Distribution Assumptions • Unlike any other BMP, the assumed snow size distribution depends on both ice water content (qs) and temperature (T), and • It is represented as a sum of exponential and gamma distributions. , ,,and , Field et al. (2005)
Black dot : bin model Red + : observation Gray line : PSD this study used • Field et al. (2005) provided simple power-law relations and constants to precompute various moments of the particle size distribution (PSD) when only the temperature and snow content are known. () • By satellite observations are strongly encou-raged to include both the cloud ice and snow species since snow size distribution overlaps the cloud ice category. • Rather the setting up a constant collection efficiency of 100%, the new scheme applies a variable efficiency based on the median volume diameter of snow and cloud water. (Wang and Ji, 2000) • The constants for computing the snow terminal velocity were chosen to match vertically pointing Doppler radar data and observations.
Outline • Introduction • Snow distribution assumptions • Bulk snow density • Particle size distribution (PSD) • Results of sensitivity experiments • Sensitive experiment design • Results • Shallow/warm cloud system • Deep/cold cloud system • Discussion • Snow geometry • PSD diagnostic method • PSD shape
Cloud Top Temperature (CTT) = -13 0C • Repeating the 2D idealized testing as previous reported in Part I. • Those simulation were run without considering radiation , turbulences, or surface fraction.
Experiment design and results a) Shallow/warm cloud system (CTT=-13 oC) Slight more 7% less twice 2/3 66% more 15 % increased Exp3 produced the most snow and least supercooled liquid water (SLW)
Cloud water Rain Snow Contour Frequency versus Altitude Diagrams (CFADs) • the assumed nonspherical snow, namely CTL and Exp1, produced more SLW and less snow than the assumed spherical snow. • the two growth processes are controlled by the particle number and surface area • In under 30 min, the snow amount in Exp2 was nearly 50 times that in Exp1 and further accelerated as riming growth commenced. • For a given snow mixing ration, the mass-weighted mean size of snow in Exp2 was larger than Exp1 CTL Exp1 Exp2 Exp3
Experiment design and results b) Deep/cold cloud system (CTT=-60 oC) 42% more 30% less 6% more
Cloud water Rain Snow Contour Frequency versus Altitude Diagrams (CFADs) • The large amount of snow in Control above the inversion was due to the more numerous small particles, the more numerous small particles were responsible for both reduced sedimentation and increased vapor depositional growth • In contract the shallow cloud, the relatively high constant-density, spherical snow of Exp2 was less efficient in removing SLW, which is why Exp2 had larger amounts of cloud water and less snow than Exp1. CTL Exp1 Exp2 Exp3
The larger snowflakes were then responsible for more efficient riming in the liquid cloud
Outline • Introduction • Snow distribution assumptions • Bulk snow density • Particle size distribution (PSD) • Results of sensitivity experiments • Sensitive experiment design • Results • Shallow/warm cloud system • Deep/cold cloud system • Discussion • Snow geometry • PSD diagnostic method • PSD shape
Snow geometry • The assumption of spherical snow with a constant density of 100 kg m-3 is a good approximation for snow around 1.5 mm in diameter. • Recent theoretical work(Westbrook et al. 2004) and empirical observations(e.g., Locatellu and Hobbs 1974; Heymsfield and Kajikawa1987; Mitchell et al. 1990; Heymsfield et al.2007) suggest that the mass of snow is proportional to D2, or alternatively, its bulk density is proportional to D-1 • Therefore, it is more realistic to adopt a mass-dimension relation of the form
PSD diagnostic method • For this work, it defined the PSD by employing both temperature and snow content using orders of magnitude observed PSDs than are found in either of the other references. Sekhon and Srivastava (1970) Houze et al. (1979) Field et al. (2005)
PSD shape • The dominate shape assumption for the snow size distribution is exponential even when the sharp is mathematically represented as a gamma distribution. • The CTL PSD shape has been determined from large database of measured PSDs using a rescaling technique to revel the underlying shape . • Doherty et al. (2007) simulated satellite brightness temperatures(~183 GHz), they found that of parameterizations examined, the combination of the Field et al. (2005) PSD and mass-diameter relationship resulted in the best agreement versus observation • Kim et al.(2007) using radar measurement were combined with Field et al. PSD to compute microwave brightness temperatuers also have a best agreement versus observation
With God all things are possible. Matthew 19:26 The End
PSD shape • CTL produced the least saturation with respect to ice whereas Exp3 produced the highest saturation and producing cloud water • The CTL experiment produced minimal liquid cloud between 0oand -10oC, • Exp1 produced only slightly more cloud water to higher altitudes around 800-600 hPa • Exp3 are not consistent with observations at all, with liquid cloud reaching above the altitude of T=-20oC CTL Exp1 Exp2 Exp3