Download
1 / 22
240 likes | 491 Views
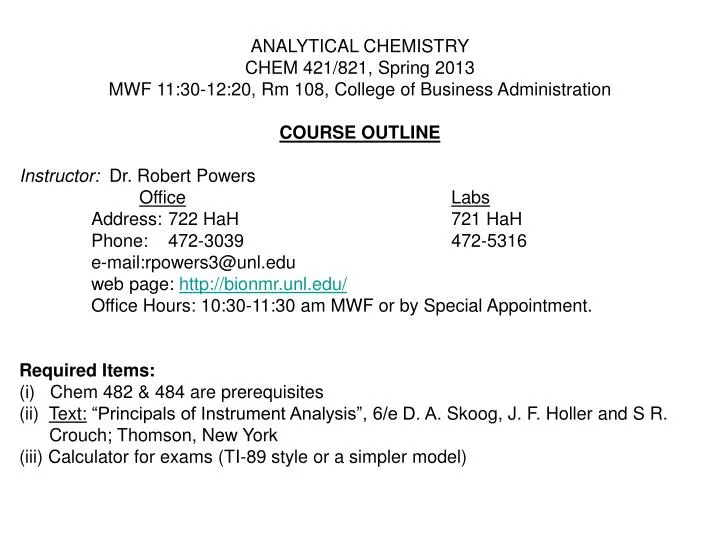
ANALYTICAL CHEMISTRY CHEM 421/821, Spring 2013 MWF 11:30-12:20, Rm 108, College of Business Administration COURSE OUTLINE Instructor: Dr. Robert Powers Office Labs Address: 722 HaH 721 HaH Phone: 472-3039 472-5316 e-mail:rpowers3@unl.edu web page: http://bionmr.unl.edu/

E N D
ANALYTICAL CHEMISTRY CHEM 421/821, Spring 2013 MWF 11:30-12:20, Rm 108, College of Business Administration COURSE OUTLINE Instructor: Dr. Robert Powers OfficeLabs Address: 722 HaH 721 HaH Phone: 472-3039 472-5316 e-mail:rpowers3@unl.edu web page: http://bionmr.unl.edu/ Office Hours: 10:30-11:30 am MWF or by Special Appointment. Required Items: (i) Chem 482 & 484 are prerequisites (ii) Text: “Principals of Instrument Analysis”, 6/e D. A. Skoog, J. F. Holler and S R. Crouch; Thomson, New York (iii) Calculator for exams (TI-89 style or a simpler model)
Course Outlined (cont.) Course Work: Exam 1: 100 pts. (Mon., Feb. 10) Exam 2: 100 pts. (Fri., Mar. 7) Exam 3: 100 pts. (Mon, Apr. 14) Final: 200 pts. (10-12, Wed., May 5) Written Report: 50 pts. (Fri., Apr. 18) Problem Sets (8): 150 pts. (various due dates) Total: 700 pts. ALL PowerPoint presentations, and answer keys for the problem sets and exams will be posted on BlackBoard. Grading scale: A+=95%; A=90%; A-=85%; B+=80%; B=75%; B-=70%; C+=65%; C=60%; C-=55%; D=50%; D-=45%; F=40%
Course Outlined (cont.) • Class Participation • Reading assignments should be completed prior to each lecture. • You are expected to participate in ALL classroom discussions • Exams • All exams (except the final) will take place at 6 pm in Rm 105, College of Business Administration on the scheduled date. • The length of each exam will be open-ended. You will have as much time as needed to complete the exam. • Bring TI-89 style calculator or a simpler model, approved translator and text book (you will be able to use certain charts, tables and appendix) • A review session will take place during the normal class time. • ALWAYS SHOW ALL WORK!!!!
Course Outlined (cont.) • Problem Sets • Problem sets are worth either 15 or 20 points each and are selected from the questions/problems at the end of each chapter in the text. • You may work together in groups, but everyone must submit their own set of answers to the problem set. • Please feel free to visit me during office hours for assistance in answering the problem sets. • You must show all work to receive full credit. • Problem sets are due at the beginning of class on the due dates listed in the syllabus course schedule. • Late Problem sets will incur a 5 point penalty. • Problem sets will not be accepted after the next problem set due date has occurred or after the last day of class.
Course Outlined (cont.) • Problem Sets (cont.) • Students generally perform very well on the problem set, which provides a “grade cushion” to the more challenging Exams. • PLEASE DO THE PROBLEM SETS! • DO NOT USE THE INTERNET, ANSWER KEYS OR SOLUTION MANUALS TO COMPLETE YOUR PROBLEM SET. • Failure to comply will result an automatic zero score for ALL problem sets. • You will receive a zero out of the possible 150 points • Penalty will occur for a single infraction. • A single problem on a single problem set – no exceptions.
PAPER ON INSTRUMENTAL METHODS • Paper General • 4-5 pages single space text • Additional pages for figures, references • 12 pitch font • Double spacing between paragraphs and headings • Paper Topic • Instrumental method • Principals behind technique • How the technique is used • Kind of instrumentation • What samples are used • Advantages/disadvantages
PAPER ON INSTRUMENTAL METHODS • Application of instrumental method • Brief review of the properties of sample of interest • How these properties are used to analyze sample • What types of techniques are available • Advantages/disadvantages • Source of ideas • Journals: Analytical Chemistry, Analytical Biochemistry Trends in Analytical Chemistry(TrACs), C&E News, Science, Nature • Grading (50 points total) • Content • Clarity of Presentation • Comprehension of material • Paper topic needs to be approved by Monday, March 10th • Due Date: 11:30 am, Friday April 18th
PAPER ON INSTRUMENTAL METHODS • Your Paper is Not a “Cliff” Notes Summary of a Scientific Journal Article • Write the paper in a manner that explains the technique or application to a colleague or friend • Use Specific Data and/or Comparisons • Examples: • Poor – “mass spectrometry is very sensitive” • Excellent – “mass spectrometry has very high femtogram limits of detection compared to the micrograms required by NMR. • Use Figures within the text • It is much easier to describe a concept or results by referring to and describing the details of a figure • DO NOT PLAGIRAZE! • Plagiarism will result in an automatic failing grade and the incident of academic dishonesty will be reported to the Dean of Students.
Lecture Topics Date Chapter Topic I. Introduction to Analytical Chemistry Jan 13 Chap 1 Introduction II. Spectroscopic Methods Jan 15 Chap 6 Introduction to Spectroscopy Jan 17 Chap 6 Jan 22 Chap 7 Instrumentation for Spectroscopy Jan 24 Chap 7 Jan 27Problem Set #1 due Jan 29 Chap 13-14 UV/Visible Molecular Absorption Spectroscopy Jan 31Chap 13-14 Feb 3 Chap 13-14 Feb 5 Chap 15 Molecular Luminescence Spectroscopy Feb 7Problem Set #2 due Feb 10EXAM 1 Feb 12 Chap 16-17 Infrared Spectroscopy Feb 14 Chap 16-17 Feb 17 Chap 18-19 Raman Spectroscopy Feb 19Problem Set #3 due Feb 21 Chap 8-10 Atomic Spectroscopy Feb 24Problem Set #4 due Feb 26 Chap 26 Introduction to Chromatography III.Separation Methods Feb 28 Chap 27 Gas Chromatography Mar 3 Chap 27 Mar 5Problem Set #5 due Mar 7EXAM 2
Lecture Topics Date Chapter Topic Mar 10 Chap 28 Liquid Chromatography/Paper Topic Approvals Mar 12 Chap 28 Mar 14 Chap 29-30 Other Separation Methods Mar 17Problem Set #6 due IV. Electrochemical Methods Mar 19 Chap 22 Introduction to Electrochemistry Mar 21 Chap 22 March 23-30 Spring Break Mar 31 Chap 22 Apr 2 Chap 23 Potentiometry Apr 4 Chap 23 Apr 7 Chap 24 Coulometry Apr 9 Chap 25 Voltammetry Apr 11Problem Set #7 due Apr 14EXAM 3 V.Other Techniques Apr 16 Chap 19 NMR Apr 18 Chap 19 Instrumental MethodsPaper Due Apr 21 Chap 19 Apr 23 Chap 19 Apr 25 Chap 11,20 Mass Spectrometry Apr 28 Chap 11,20 Apr 30 Problem Set #8 due May 2 Review Session May 5FINAL EXAM
Introduction to Analytical Chemistry Background A.) ANALYTICAL CHEMISTRY: The Science of Chemical Measurements. B.) ANALYTE: The compound or chemical species to be measured, separated or studied C.) TYPES of ANALYTICAL METHODS: 1.) Classical Methods (Earliest Techniques) a.) Separations: precipitation, extraction, distillation b.) Qualitative: boiling points, melting points, refractive index, color, odor, solubilities c.) Quantitative: titrations, gravimetric analysis 2.) Instrumental Methods (~post-1930’s) a.) separations: chromatography, electrophoresis, etc. b.) Qualitative or Quantitative: spectroscopy, electrochemical methods, mass spectrometry, NMR, radiochemical methods, etc.
CHOOSING AN ANALYTICAL METHOD What Factors to Consider: What type of information does the method provide? What are the advantages or disadvantages of the technique versus other methods? How reproducible and accurate is the technique? How much or how little sample is required? How much or how little analyte can be detected? What types of samples can the method be used with? Will other components of the sample cause interference? Other factors: speed, convenience, cost, availability, skill required. How Do We Answer or Address These Questions?
CHARACTERISTICS OF AN ANALYTICAL METHODS Accuracy: The degree to which an experimental result approaches the true or accepted answer. Ways to Describe Accuracy: Error: An experimental measure of accuracy. The difference between the result obtained by a method and the true or accepted value. Absolute Error = (X – m) Relative Error (%) = 100(X – m)/m where: X = The experimental result m = The true result All Methods, except counting, contain errors – don’t know “true” value Two types of error: random or systematic
CHARACTERISTICS OF AN ANALYTICAL METHODS Random Error: results in a scatter of results centered on the true value for repeated measurements on a single sample. Systematic Error: results in all measurements exhibiting a definite difference from the true value Random Error Systematic Error plot of the number of occurrences or population of each measurement (Gaussian curve)
CHARACTERISTICS OF AN ANALYTICAL METHODS Precision: The reproducibility of results. The degree to which an experimental result varies from one determination to the next. Precision is related to random error and Accuracy is related to systematic error. Illustrating the difference between “accuracy” and “precision” Low accuracy, high precision Low accuracy, low precision High accuracy, low precision High accuracy, high precision
CHARACTERISTICS OF AN ANALYTICAL METHODS Ways to Describe Precision: Range: the high to low values measured in a repeat series of experiments. Standard Deviation: describes the distribution of the measured results about the mean or average value. Absolute Standard Deviation (SD): Relative Standard Deviation (RSD) or Coefficient of Variation (CV): where: n = total number of measurements Xi = measurement made for the ith trial = mean result for the data sample
CHARACTERISTICS OF AN ANALYTICAL METHODS Response: The way in which the result or signal of a method varies with the amount of compound or property being measured. Ways to Describe Response: Calibration Curve: A plot of the result or signal vs. the known amount of a known compound or property (standard) being measured.
CHARACTERISTICS OF AN ANALYTICAL METHODS Parameters used to Describe a Calibration Curve: S = mc + Sbl S – measured signal c – analyte concentration Sbl – instrument signal for blank Sensitivity:calibration sensitivity = slope (m) of calibration curve. analytical sensitivity (g) = slope (m)/standard deviation (Ss) ability to discriminate between small differences in analyte concentration. Slope and reproducibility of the calibration curve. Method A Method B
Selectivity: degree to which the method is free from interference by other species in the sample No method is totally free from interference from other species. Selectivity coefficient (k): kB,A = mB/mA Relative slopes of calibration curves indicate selectivity: S = mA(cA + kB,Acb) + Sbl Species A Species B Interested in detecting species A, but signal will be a combination of signal from the presence of species A and species B.
Limits of Detection (cm ): (minimum analyte signal(Sm) - mean blank signal( ))/slope(m) minimum/maximum concentration or mass of analyte that can be detected at a known confidence level. Signal-to-noise Ratio (S/N): Noise: random variation in signal or background Signal: net response recorded by a method for a sample (Note: a value of S/N = 2 or better is considered to be the minimum ratio needed for the reliable detection of a true signal from a sample.) Estimate S/N: • Multiple determination of blank samples. • Estimation of best-fit to calibration curves signal noise
Dynamic Range: linear region of calibration curvewhere the lower limit is ten times the standard deviation of the blank. LOQ - limit of quantitation LOL - limit of linearity Concentration (mM)
Example 1: The data in the table below were obtained during a colorimetric determination of glucose in blood serum. A serum sample gave an absorbance of 0.350. Find the glucose concentration and its standard deviation, calibration sensitivity, detection limit and dynamic range.