Download
1 / 8
80 likes | 214 Views
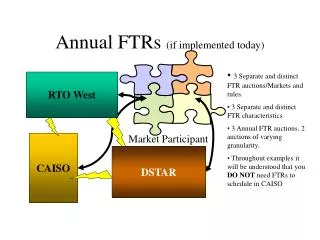
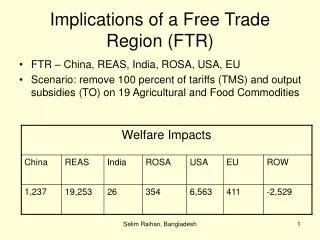
Implications of a Free Trade Region (FTR). FTR – China, REAS, India, ROSA, USA, EU Scenario: remove 100 percent of tariffs (TMS) and output subsidies (TO) on 19 Agricultural and Food Commodities. Removal of Tariffs in the Free Trade Region (FTR). Simulation – Removal of Tariffs in the Region

E N D
Implications of a Free Trade Region (FTR) • FTR – China, REAS, India, ROSA, USA, EU • Scenario: remove 100 percent of tariffs (TMS) and output subsidies (TO) on 19 Agricultural and Food Commodities Selim Raihan, Bangladesh
Removal of Tariffs in the Free Trade Region (FTR) Simulation – Removal of Tariffs in the Region Simulated alternative Tariff Reductions Tariff reductions set at 30%, 50%, 70% and 100% of existing TMS Rate Conclusion: All countries that joined the Free Trade Region had positive welfare impacts for all reductions except one – India. Paul J. Thomassin, McGill University
Welfare Effects Paul J. Thomassin, McGill University
Welfare Decomposition Paul J. Thomassin, McGill University
Why? • The reason for the decrease in allocation efficiency from MTAX is from trade diversion. • The main commodity causing this is Vegetable Oils and Fats (VOL) from Indonesia and Malaysia Paul J. Thomassin, McGill University
Page 1 Withdrawal of output subsidies in agriculture in SIX regions I look at the welfare change 3 countries (IND, USA and EUR) are gaining 3 countries (CHN, REAS and ROSA) are loosing I concentrate on why REAS is loosing Welfare decomposition figures suggest that welfare loss in REAS is caused by loss in allocative efficiency and loss in terms of trade. I further concentrate on the loss in allocative efficiency The Puzzle Why there is a loss in allocative efficiency in REAS even though output subsidies on agriculture have been withdrawn. Selim Raihan, Bangladesh
Page 2 Withdrawal of output subsidies in agriculture in SIX regions You can have a decrease in allocative efficiency after a removal of output subsidies if after liberalization there is an expansion in the sectors who were previously receiving output subsidies. Therefore, we should check ‘qo’ (industry output of commodity i in region r) 4 sectors were receiving output subsidies in agriculture in REAS: Paddy rice (PDR), Oil seeds (OSD), Live animals (CLT), and Raw milk (RMK). Simulation results suggest contraction of output in OSD, CTL and RMK (which are as expected). BUT, interestingly, output of Paddy Rice increases. Decomposing ‘qo’ suggest that the increase in output in Paddy rice is primarily driven by the increase in exports of PDR from REAS. The share of exports of PDR from REAS in total PDR output in REAS is more than 88%. Selim Raihan, Bangladesh
Page 3 Withdrawal of output subsidies in agriculture in SIX regions Why do Exports of PDR from REAS increase? REAS and USA are the two major players in the international PDR export market, having 49% and 13% share in global PDR exports (‘VXWD’). Base data on output subsidies suggest that USA has the highest rate of ‘to’ on PDR (86%), whereas REAS has only 2%. Therefore, the withdrawal of output subsidies on PDR in USA make USA PDR expensive both at domestic and international market. This can be explained by the fact that ‘PMS’ (PDR, USA, REAS) increases by 64%, while ‘PMS’(PDR, REAS,REAS) increases by only 2%. Production of PDR in USA declines by 55%. Therefore, exports of PDR from USA to REAS decreases and exports of PDR from REAS to both USA and REAS increase. The changes in volume of exports confirm that the increase in intra-regional trade of PDR in REAS is the principal contributor of the increase in exports. Finally, a decomposition of the allocative efficiency also suggest that there is a loss in import tariff revenue, because of the fall in imports in RESA since composite import price (‘pim’) increase. Selim Raihan, Bangladesh